
RAVE EVENT DEPTH ANALYSIS: QUANTITATIVE FINANCIAL MODEL FOR FRAGMENTATION, FRAGMENTATION AND LIQUIDATION
Foreword
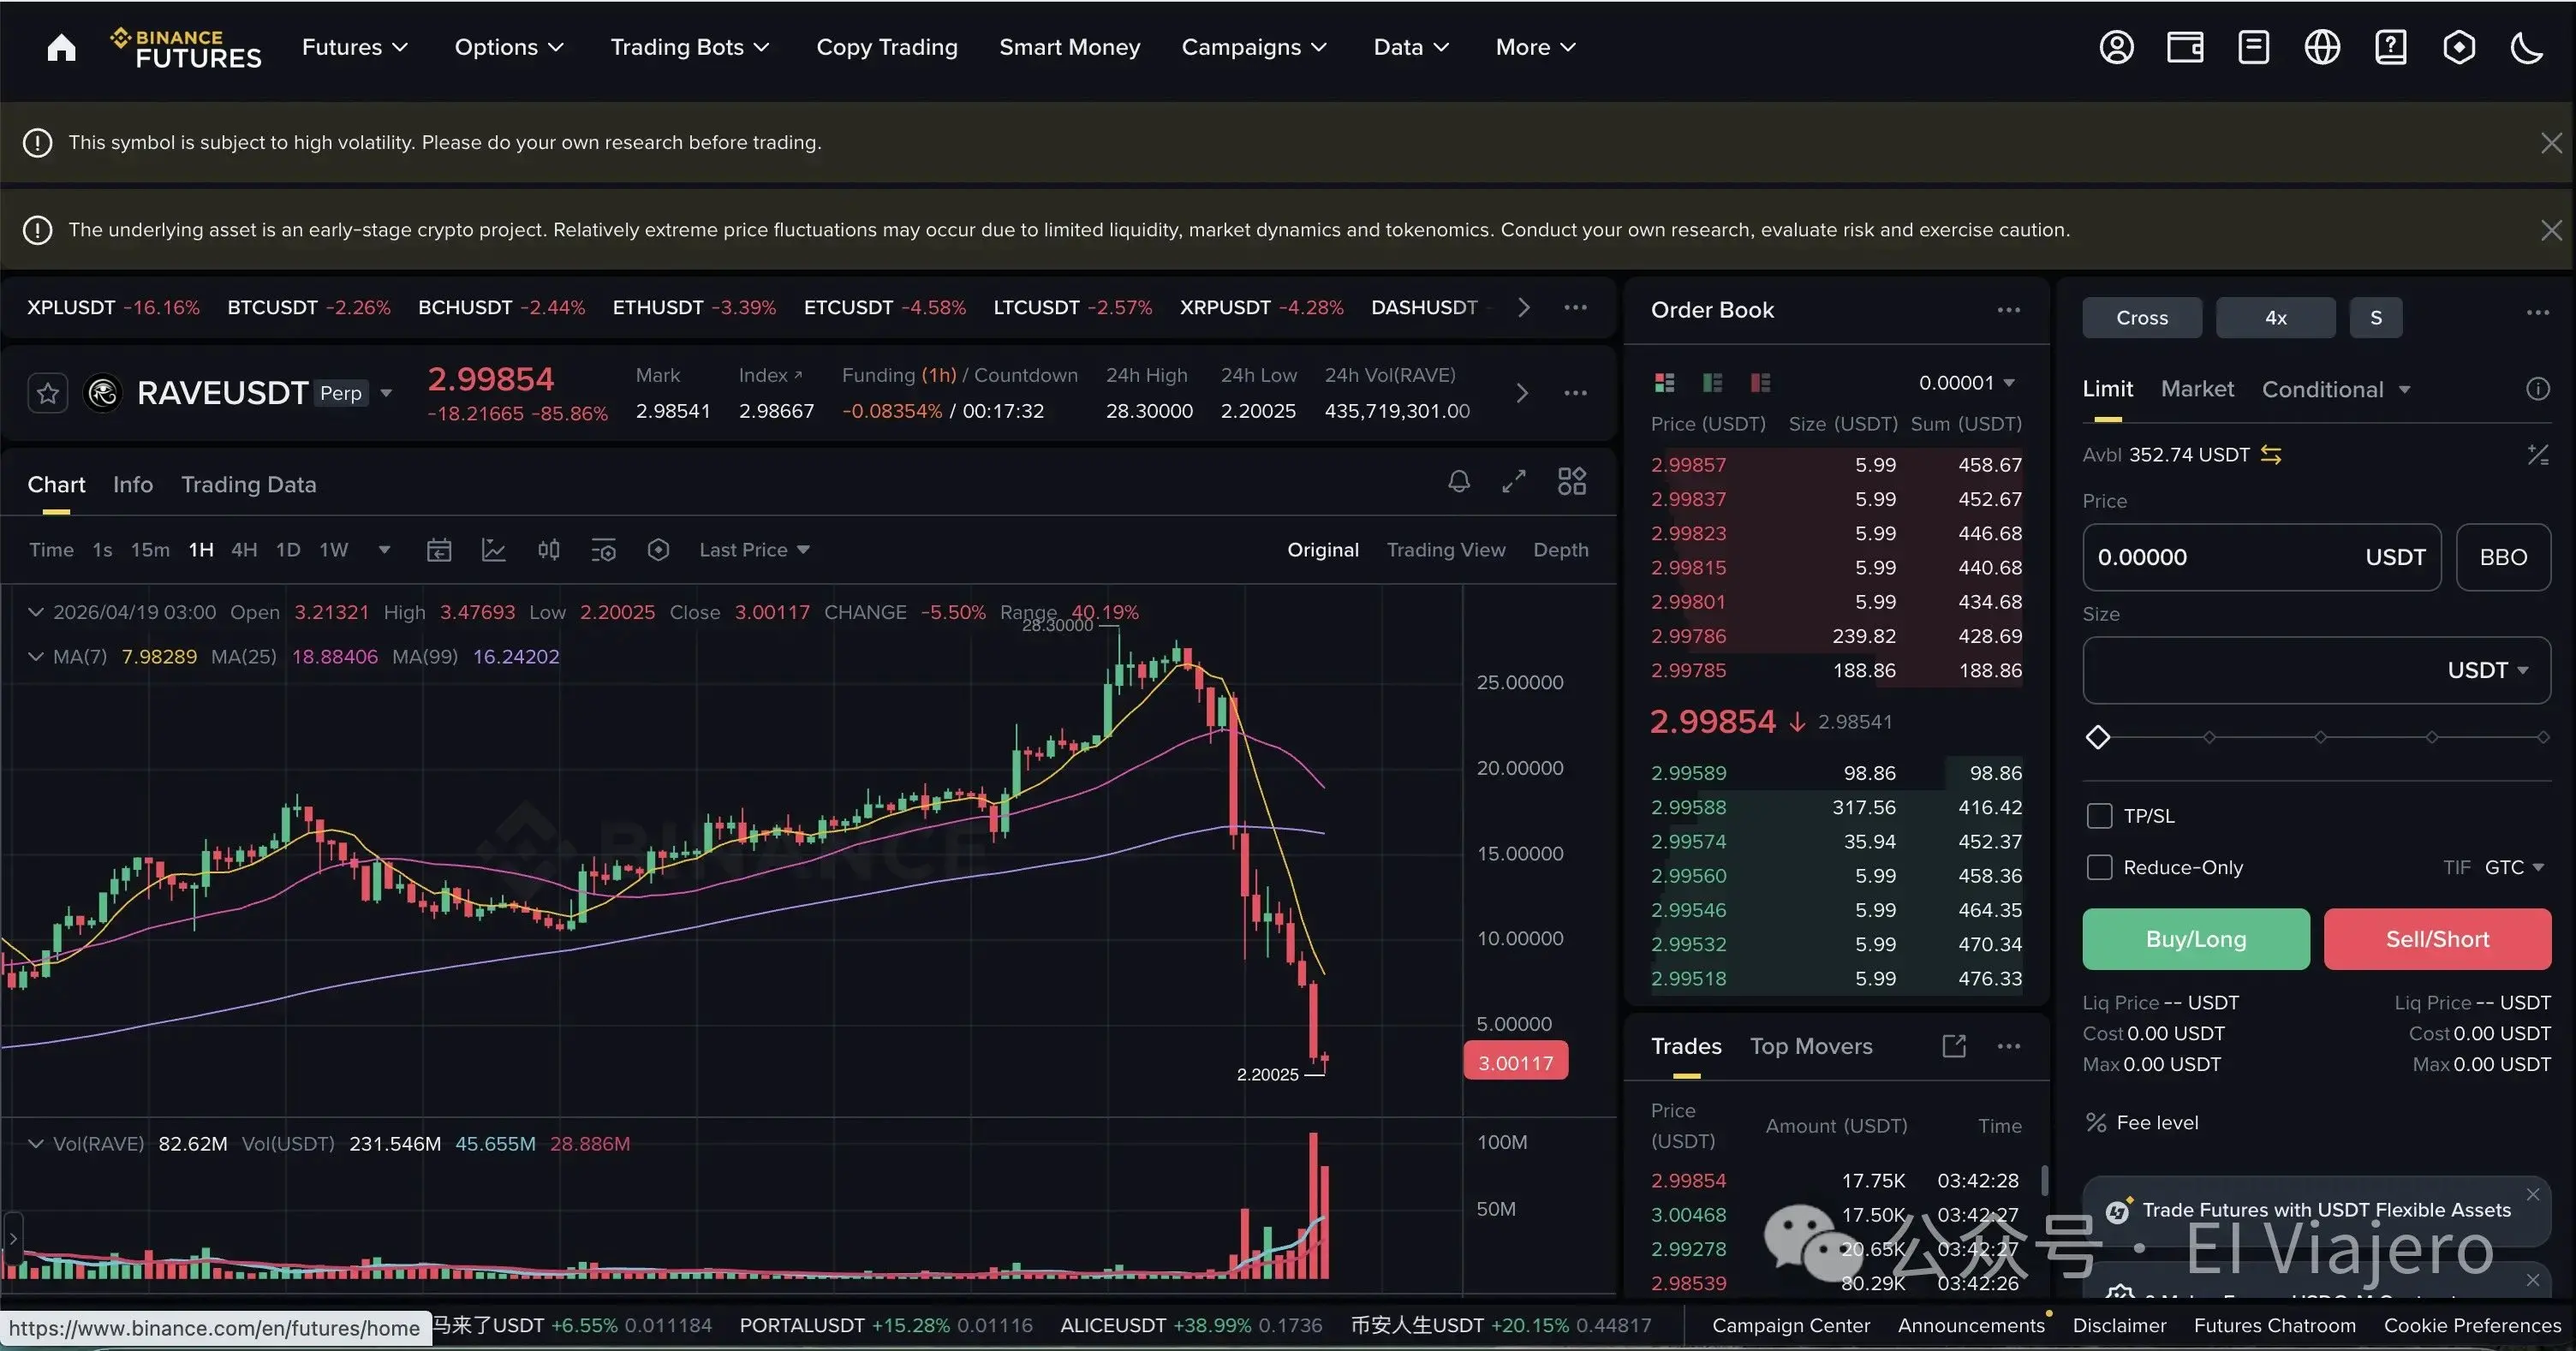
IN MID-APRIL 2026, THERE WAS A BLOODY HARVEST AT THE TEXTBOOK LEVEL IN THE ENCRYPTED CURRENCY MARKET — THE DOLLAR RAVE TOKEN THAT WENT THROUGH A FULL CYCLE OF INNUMERABLE BOOMS, FRENZYS, STAIRFALLS AND, ULTIMATELY, ALMOST ZERO. MILLIONS OF SCATTERED FAMILIES BURST INTO THE FIELD, DRIVEN BY SOARING FOMO EMOTIONS, AND WERE IMMEDIATELY SWALLOWED UP BY THE DEATH SPIRAL OF THE SILO. AS OF APRIL 19TH, THE DROP WAS ALMOST 90% AT 3:00 A.M。

This is not an isolated event, but rather a standard script with high control of the repeated display of the tactile coin。
To truly see such “Short Squeeze” and “high-control” financial harvesters, we have to move away from a simple K-line, into micromarket structures and quantitative finance。
The dealer's manoeuvres are not simply a “split pull”, but a sophisticatedly calculated mobility manipulation and derivative arbitrage. We can use a number of core mathematical and economic models to completely dismantle this “scrambling logic” that eats alive in the open。
THIS PAPER WILL BE BASED ON AN EXAMPLE OF THE RAVE EVENT, A COMPLETE LOGICAL CHAIN OF THE LIMITATIONS OF THE MODEL OF THE RISE (SQUARE-TO-ZERO) COLLAPSE (SQUARE-TO-SQUARE-SQUARE-SQUARE-SQUARE) COLLAPSE (SQUARE-TO-SQUARE-SQUARE) FALL (SECOND-TO-THRUST DEATH RESISTANCE)。
Chapter 1: Rise logic — how the dealer uses precision calculations to skin the scattered
Model I: Liquidity depletion and price shock model (Kyle's Market Impact Model)
Dealers can raise prices with little money, at the heart of which is “controlling circulation”. In quantitative finance, we usually use Kyle (1985) price shock models to explain the impact of orders on market prices。
In a normal market, price changes can be simplified into the following formulas:

-
Delta P: Extent of movement in asset prices。
-
Delta Q: Number of orders bought or sold。
-
lmbda (Kyle's Lambda): penultimate of the parameters of market liquidity depth, representing “market non-liquidity”. The worse the liquidity, the greater the value \lambda。
Dealer operation:The dealer transfers the tokens out of the exchange in the chain or removes all the bills of sale at the spot point. This could lead to a sharp drop in the stock depth (Depth) on the exchange, making \\lambda \to \infty。
In this extreme non-mobility situation, even a very small amount of money \Delta Q (e.g., tens of thousands of dollars) is bought at a market price, multiplied by the proximity of an infinite \lambda, which can produce an extremely large \Delta P (e.g., 50 per cent instant pull). And that's why you'll see that there's often a "no-volume surge" on the K line。
Model II: Funding Rate Bled Model
The central mechanism of the Perpetual Futures contract is the Funding Rate, a “water pump” that the dealer continuously extracts from his family's blood without selling the goods。
The core calculation for F is based on a premium of contract and spot index prices (Premium):

-
P {text{perp} : Prices for a lasting contract。
-
P {text{index}: spot index prices。
-
I: BASE RATE (USUALLY SMALL, NEGLIGIBLE)。
-
\\text{Clamp}: exchange-set rates above and below (e.g. 2% or -2%)。
Dealer operation:When the bulker sees the price booming, the huge empty billing in the contract market will push down the contract price, resulting in P {text{perp}} < P {text{index}}. At this time the premium is negative, the fund rate F becomes extreme negative (e.g., every 4 hours - 2%)。
This means that too much has to be paid for。

THE DEALER, AS THE LARGEST NUMBER (POSSESSED IN CASH AND POSSIBLY IN THE FORM OF MORE THAN DOUBLE THE AMOUNT OF THE CONTRACT), COLLECTS THE PROCEEDS OF THE FEE FOR EACH PERIOD:

As long as the volume of vacant contracts is large enough, a dealer can generate millions of dollars in risk-free cash flows on a daily basis for “passage fees”. This is the mathematical truth of a dealer who “does not seem to sell money and can make money”。
Model III: Forced laceration effect
This is the bloodiest link in the drive-by, commonly known as the “explosive chamber”. Contract transactions are leveraged, and when prices rise to a certain level, the exchange ' s engines force them to take over the open house and buy the flat market price。
For a bulker with a P 0 bill of lading, leverage rate L, maintenance bond rate M m, the price of the bursting warehouse (Liquidation Price)P {text{liq}} is:

Linked calibration:When the dealer pushes the price to P {text{liq}, the exchange system automatically throws into the market a market price purchase. This forced purchase will immediately lead to a further price increase:

This creates a deadly positive feedback loop (Positive Feedback Loop): Price increases \to trigger burst warehouse receipts \to system market prices further increase \to trigger higher blast warehouse receipts \to system buy again。
In mathematics, it's a dispersed exponential function. The situation at this time does not require the dealer to spend a penny to pull the plate, and an empty warehouse receipt (compulsory purchase of the plate) has become an unlimited fuel to drive up the priced rocket。
Model IV: The final game of the crash
Finally, we explain in Game Theory** the prisoners' plight (Prisoner's Dilemma)** why the top of this currency has never been a slow fall, but an instant “crash to zero”。
Assuming there are two major dealers in A and B, they share the vast majority of the cash. At high levels, they faced two options: to continue the drive (Hold) or to smash the set (Sell)。
Its revenue matrix (Payoff Matrix) is as follows:

In cases where spot prices are extremely high and there is no real buy-in at all below (very bad liquidity), whoever sells it first will be able to eat the little cash bill that remains in exchange for real silver and silver。
According to Nash Equilibrium, while both sides continue to receive long-term financial gain from the drive (Hold, Hold), as there is no guarantee that the other party will not betray, the “Sell” becomes the strict advantage of both sides (Stractly Dominant Strategy)。
Trust within the Alliance is therefore extremely fragile, driven by absolute interests. As long as the price reaches a certain psychological threshold, or as long as there is any wind-blowing movement, one of the dealers will choose the “Front-running”. \lambda (liquidity countdown) also works in the opposite direction when the first sky-shattering list appears – very few pushes can bring prices down 90% in an instant. That's why the crash always happens in a moment。
Chapter 2: The logic of falling -- why the crash always falls to zero
There's a fatal illusion in many of the caravans when they look at the disk: "It's now worth $100, and if it falls, it's going through 90, 80, 70." But in reality, once the high-controlled tokens collapse, the K line is often a vertical "head guillotine" that doesn't bounce, and hits directly from 100 to 1 or 0.0001. This phenomenon is referred to in the area of professional finance as** “Liquidity Vacum” or “Flash Crash”**。
To understand why prices are “zero in the moment” rather than “slow down”, we need to get out of the K-line and go deep into the Order Book microstructure at the bottom of the trading engine。
The following are the four deep mechanisms that led to the instant zeroing of prices:
Section I: Four mechanisms for the mobility vacuum and instant collapse
The price of Price & Price VacuumFirst, we need to establish a basic financial commons: the “current prices” on the face of the table, which merely represents the “transaction of the last deal”, which in no way represents the value of the entire plate. The price is supported not by the market value but by the “Bids” in the order book。
-
Normal markets (e.g. bitcoin):Between $100 and $90, there's thousands of bills hanging around. You're gonna need a lot of money to eat all the money. It's called deep。
-
Controlled by a mobile vacuum:After the dealer pulls 100 dollars, there's no such thing as a bulk drive down there. The order book may be:
-
99 dollars: 10 bills
-
$95: There are 5 bills
-
Between $94 and $2: 0 bills
-
One dollar: 1,000 bills
-
What does the dealer do when he decides to deliver the goods and throws out a 100-dollar order? It's going to eat 99 dollars and 95 dollars of 15 bills in an instant, and it's not done (85 still). Because there's no bill in the middle, the engine skips all the prices from $94 to $2 and goes straight to $1 for the deal。
And in the eyes of the world, what happened this second was that the price went from 95 dollars to 1 dollar. There is no buffer at all because there is no money in the middle。
Market traders' “wireline” self-insurance (Market Maker Withdrawal / Spoofing)In general, in order to make the portfolio look active, the dealer or a marketer robot would put up a large number of false purchase and sale orders at each price (which is called providing liquidity)。
But these robots are very smart and cold. Their algorithms have a rigid condition: once a market is detected with a massive unilateral push (e.g., the main power dealer starts to smash) or a Volatility break-through threshold, robots will cancel all the payments within milliseconds。
It's like you're standing on a 100-story floor, and it's full of gas pads. The moment you jumped, the people below pulled all the gaskets. You're gonna have to hit it hard on the cement floor on the first floor. And that's why when the crash happened, there was no small rebound。
3. Slippage and Wealth DestructionWe can use the mathematical model **Slippage** to explain how wealth evaporates. The slide point refers to the difference between your expected selling price and the actual transaction price。
When liquidity is depleted, the average market price sold can be expressed in the following simplified formula:

P i is the price of the price limit, V i is the amount of the price hanging, V {text{total} is the sum of your sales
When the dealer holds 10,000 coins at a book value of $100, it looks like $1 million. But if the down payment is extremely thin (e.g. the above-mentioned liquidity vacuum), the actual weighted value of 10,000 dollars may be $2.00. The dealer ended up with only $20,000, and the remaining $980,000, the “market value”, was not earned by anyone, but by the fact that there was no real money to take over, and it went down at the math level。
4. Leverage Clearing Falls (Liquidation Cascade)Combining the contract market we mentioned earlier. When the dealer's big bill hits the price from 100 to 50, it triggers a large bulky of long-solder (e.g. 80, 90)。
The essence of the multiple silo is that the system imposes “market prices”. As a result, the dealer's shatter triggered the forced sale of a bulky, which once again hit the order book, which no longer pays, and then hit the price at 20, which triggered a 50-squared single-explosion warehouse and created a death spiral until the price was zero and all leverage was completely wiped out。
Liquidity vacuum summary:The price fell from 100 to one, without a 99-dollar push, with only 99 in the middle, and nobody bought it. In these unsupported funds, high prices are like a sheet of paper hanging above the abyss. As long as the dealer cuts through this layer of paper, or as a marketer removes the bricks from the cushion, the price will be in full compliance with the law of free fall, returning in one second to its true value — zero。
Section II: The micro-mechanism of the descending ladder - why not a straight-to-zero line, but a collapse of the step
The phenomenon you've observed is very sensitive. In an extremely violent collapse, it rarely presents a perfect vertical line, but rather a “stair-step decline”. For each integer level (e.g., from $15 to $14), the price stops at that location, even a small rebound for a few minutes and then continues to smash。
This phenomenon has a very clear physical and gaming logic in the financial microstructure (Market Microscructure), which is largely the result of four mechanisms, each of which has its own mathematical profile:
“Integer-level resistance” in order books: concentration of psychological priceOn the Limit Order Book, there is a natural “Rund-number Bias” integer and some institutions. When the price is $16, a lot of people who try to get a bottom check will hang the price limit at this integer level of $15.00, $14.00. When the prices hit those positions, Market Sells, an empty and seller, hit the “ceiling wall”。
-
The essence of the disc:The seller needed time to “eat” all the payments that were hanging at the integer level. These few minutes of twilight are, in fact, a war of depletion between the two sides at certain prices. Once the purchase of a single wall has been depleted, the price slips into the next vacuum。
Mathematical painting — order book density accumulation model:We can engrave the sum of the purchase points around the integer level with the Goss nuclear function. Assuming P is price, the integer level is K i (i = 14, 15, \\dots), the unit density function \\rho(P) at the integer level is:

-
\\rho 0: base order density (a thin purchase order at non-integer prices)。
-
A i: Total number of purchase orders in the vicinity of the integer price position K i。
-
\sigma: the psychological concentration of the " integer preference " of the dispersed family. the smaller the \sigma, the more the bill is concentrated in integers。
When P\to K i is priced, the \\rho(P) peaks and forms a “buy one wall”. The seller must consume time to digest the purchase:

Where v {text{sell} is the seller's sales rate. This \Delta t is the mathematical essence of "a few minutes per dollar drop."。
2. Short Covering: reverse purchasing powerMany have ignored a basic business commons: flatting the blanks, actually buy to cover。
When the money that's empty in 20 is seen to fall to $10 or $15, they need to put in a bag. In order to calm down, they must buy on the market. This huge buyout resulting from the profit of the empty head creates a hedge between the sale in a short period of time and in a panic, thus imposing price parity, resulting in a few minutes of partial rollover。
Mathematical drawings - an accumulation probability model for empty silos:Assuming an empty opening price is \\bar{P} text{short} and the current price is P. The probability of choosing a flat on empty head rises with the floating margin, and can be painted using the cumulative distribution function of the normal distribution (CDF):

-
S {text{total}: total empty warehouse。
-
\\Phi: A cumulative distribution function of the standard normal distribution。
-
\sigma p: empty “profit-take-all tolerance” - tends to be flat when it's too big。
When prices drop by a dollar, there is an empty pool that reaches its flat threshold, generating sudden buy-out pulses. This pulse temporarily offsets sales pressure and forms a short price platform。
Decline in the “cooled zone” of the blast chamber fault and the Hawks processAs we mentioned earlier, the “Cyclops of Blast” (Hox Process) is a wave of energy releases。
When the price fell at $15 in an instant, it triggered all the multiple stopovers and bursting warehouse receipts in the vicinity, causing the price to crash to $14.20 in an instant. However, between 14.20 and $14.00, there may not be a new warehouse receipt that has been triggered for the time being。
At this point, the market is in a “energy-depletion” vacuum. It would have to wait for a few minutes to create a new panic among the bulky on the board, or for the price to slow down to $14.00 to trigger the next round of a serial burst. These are the minutes of a “cooling period” between two waves of trampling。
Mathematical painting - cooling time model for the Hawks process:Review of the condition intensity function of the Hawks process:

After the last wave of blast (in t 0), the auto-intensity item declines over time. The market enters a cooling period when the intensity of the event is reduced to near base level. We can define cooling time

-
N: NUMBER OF INCIDENTS TRIGGERED IN THE PREVIOUS BLAST CHAMBER。
-
\beta: panic decay rate。
This \Delta T {text{cool} accurately depicts the "cross-board window" between the two waves of the crater. The few minutes you've seen across the board are when the Hawks process is waiting for the next wave of self-absorption to be rekindled。
4. SUSPENSION OF THE RE-PRICING OF HF MARKET VENDORS (MM)In extreme unilateral decline, high-frequency commercial robots that provide mobility carry enormous risks. When prices jump sharply (e.g. by a dollar within a minute), the wind algorithm of a marketer is triggered。
At this point, all purchase orders (i.e. the mobility drain referred to above) are temporarily withdrawn by algorithms or the difference in prices is significantly increased. After a few minutes of calculations, the current market volatility and its own openings were reassessed before the marketer re-ordered the new price zone. In these few minutes of “mechanical wind rebooting”, the surface tends to get stuck in a grid。
Mathematics - Avellaneda-Stoikov is the best price differential model for the market:In the core model of high frequency doing business (Avellaneda & Stoikov, 2008), the best offer for doing business depends on the current volatility and remaining time:

-
s: Best trade price differential (Bid-Ask Spread)。
-
\gamma: risk aversion factor for marketers。
-
\sigma: current market volatility。
-
T-t: Remaining time from liquidation。
-
k: order flow strength parameters。
Key inferences:the best price differentials s will increase dramatically when the crash leads to a \sigma surge. the algorithm for doing business would immediately remove the original offer and enter the "wind control restart" state. at this point, the profile is: \\approx 0. the higher the volatility, the closer the liquidity to zero. the marketer has to wait for \sigma to return to acceptable levels before re-offending, and this waiting period is the "dileze" on the face。
Stepping down:What you see is “a few minutes across the board for every dollar you drop”, which is in fact ** throwing at the combination of eating multiple defenses (the whole number buys a wall \rho(P)), empty bulkings (the flat purchase plate \text{Buy}), bursting energy in cooling (Hox \Delta T {text{cool}), re-pricing marketers (AS model s expansion)。
The fall of this ladder is often more frightening than the fall of the straight line, because it keeps giving people the illusion of “falling down, holding up” and seducing new leverage to enter the field and then hang it again. Each of the discs is not “stopping the fall”, but the energy savings of the next wave。
Section III: Mathematical drawings of crashes - three-storey quantitative models
Attempts to quantify and depict the fallout with rigorous mathematical models are at the heart of professional quantitative trading and financial engineering. Traditional linear or normal distribution models (e.g., simple normal distribution randomly evaporated) are totally ineffective for extreme declines characterized by short-term surges, extreme “foam break-ups” and “liquid depletion”。
In order to accurately paint this decline, the following three levels of models are usually used in financial mathematics, ranging from macro-foam break-ups to micro-stepping. This is the only physical and mathematical process that can be restored to the crash:
MACRO-EARLY WARNING OF FOAM BURSTING: LOGARITHMIC HETEROGENEITY MODEL (LPPLS)The LPPLS (Log-Periodic Power Law Singularity) model, presented by physicists and financier Didier Thornette, is the most classic mathematical model that currently depicts “foam build to the limit and eventually collapse”. It sees market frenzy as a physical “critical shift” that fits perfectly into a spiral of zero。
its core equation is the natural logarithm of the proposed asset price \ln p(t):

-
t c (Critic Time): Critical time, which is the mathematical singularity of the collapse predicted by the model。
-
A, B, C: CONSTANT PARAMETERS, REPRESENTING, RESPECTIVELY, INTRINSIC VALUES, FOAM GROWTH RATES AND VOLATILITY。
-
(t c - t) ^m: triple index, depicting ultra-indexed growth (i.e., surge phase) at the t c point of price convergence。
-
\cos (\omega \t c-t)+ \phi): paints the logarithmic frequency of periodic convulsions in response to emotional fluctuations when prices are approaching collapse。
I'm not sure what I'm talking aboutAs time t approaches t c, positive feedback from the market reaches its limits and the system becomes extremely vulnerable. Once t c is crossed, the formulae collapses, and prices fall “squarely”。
2. Sudden cliff fall: Merton Jump-Diffusion ModelIn standard options pricing and asset path simulations, prices are usually assumed to be continuously volatile (geometric Brown movement). But crashes are usually accompanied by “down-plugs” or “jumps”. The Merton Jump-Exploding Model adds a Poisson Process to successive fluctuations to paint this sudden drop。
The calculus equation for asset prices S t is:

-
\mu dt + \sigma dW t: Standard Geometric Brown Part (dispersion rate \mu and volatility rate of Brown Movement \sigma), depicting the flat-time shock drop。
-
dq t: the porcelain process, which indicates whether a "jump" (i.e. a sudden crash) occurs within dt of time. the probability of occurrence is \\lambda dt。
-
Y t - 1: Draw the range of leaps. In the crash model, Y t is usually subject to a logarithmic normal distribution with an average value of much less than 1 (meaning that the price will shrink sharply in percentage terms once the jump occurs)。
I'm not sure what I'm talking aboutA perfect description of the unmovable free fall on the face when the dealer suddenly cancels the purchase price or when large houses are concentrated for sale。
3. Microsteps and serial blast: Hawkes ProcessWhen a price breaks down a key supporting position (e.g., an important integer level), it triggers a large number of multiple loss orders and multiple leverage forced silos (Liquidation). This “soldier-inducing price drop \to trigger more bills” is mathematically referred to as a self-absorption process (Self-Excising Point Production)。
The condition intensity function of the Hawks process (i.e., the probability density of a short time bill of sale) is expressed as:

-
\lambda(t): the probability of a sale at the moment t。
-
\m: base strength (normal market disks)。
-
\int (self-absorption): core. in the past, every sale (in s) has dramatically increased the probability of a new sale at the current t moment。
-
\alpha: the intensity of the panic infection every time you fall。
-
e^-\beta(t-s)}: an index decay function, which indicates the speed at which panic is gradually diminishing over time。
I'm not sure what I'm talking aboutif you see the price on the plate falling several integer levels in a second, that's how the hawks process is in reality when \alpha is extremely high。
Crash Mathematical Model Summary:The real fall to zero is not a simple downward slope, but a complex mathematical process that is co-mingled by the macro-emotional collapse predicted by the LPPLS model, the fluid breakup of the jump-spread model, the micro-closer that is driven by the Hawks process。
Chapter III: The legacy of the collapse - why double-up is almost impossible
To accurately paint the phenomenon of “extremely difficult pull after a crash” in quantitative finance, we need to introduce cross-models of micromarket structure (Micromarket Market Theory) and behavioural finance。
THE PROCESS IS ESSENTIALLY A CALCULATION: TO PUSH PRICES FROM P 1 TO THE TRUE AMOUNT OF CAPITAL THAT P 2 NEEDS TO CONSUME。
The following is a mathematical model of three professions, a layer of progressive writing of this “death resistance”。
Model 1: Order Book Capital Consumption Score Model
In order to raise the price, the dealer must buy all the price limits on Order Book with real silver and silver. We can precisely calculate the cost of the pull with a certain percentage。
Assumptions P for price, S(P) is the single density function of the price office (i.e., the number of currencies on which the price is placed). Raise the price from the initial price P 0 to the target price P {text{target} The capital to be consumed C is:

1. SCENE A: NZL (WITHOUT A PALLET)For a new currency (or the first violent lifting) there is a “vacuum” above. The product density is just a very small amount of liquidity on the market。

Because S {text{mm} is extremely small, the cost of a pull C {text{new} is very low and the dealer can fly easily。
2. SCENE B: SECOND LIFTING AFTER COLLAPSE (HEAVY PALLET)After the collapse, the structure of the order book changed qualitatively. The product density is no longer a smooth S {text{mm}, but it is a legacy of “set-down” S {text{trapped}。

The \int P \cdot S {text{trapped}(P) dP here is an extra "Asterix Set" that the dealer has to pay. Because S {text{trapped} is extremely high in history, C {text{recovery} is often 10 or 100 times greater than C {text{new}. That's why the dealer would rather send a new coin than eat it。
Model II: Prospect Theory & Pressure Distribution (Prospect Theory & Sell Pressure Distribution)
So, what exactly does S {text{trapped} look like? Why is it so hard to get rid of it
According to the Prospective Theory of Behavioral Finance and Disposability Effects, the effectiveness of the “back-to-back” is much more sensitive than “profit”. When the price is close to their warehouse cost P {text{cost}, their chances of selling the warehouse will rise exponentially。
We can use P i for the average Goss distribution (normal distribution) to paint the pressure density of some historical high-level funding:

-
V i: Total amount of money at historical price P i is traded and sequestered。
-
\sigma i: differences in the psychological expectations of the diaspora (tolerance). the closer the price line, the more concentrated it is。
Mathematical results:When the dealer pulls up the current price P\to P i, the index item \to1, S {text{trapped} reaches its peak. This means that every time prices come close to a historically intensive trade-off, the dealer hits the wall of “throwing the wall” as the mathematical formula dictates。
Model III: Dynamic Kyle Model of Asymmetric Liquidity (Asymmetric Dynamic Kyle's Model)
We're bringing these principles into the classic model of price shocks. In the Kyle model mentioned earlier, price changes \Delta P = \lambda \times \Delta Q (\Lambda is the last count of liquidity, \Delta Q is the money bought by the dealer)。
in the aftermath of the crash, \lambda becomes a dynamic function of extreme asymmetry:

-
DRAW UP:The denominator added a huge pallet S {text{trapped} leading to \lambda \to 0. This means that the dealer invests in the natural amount of money \Delta Q, and the price \Delta P is almost intact (absorbed by the pallet)。
-
DOWN DISC (DOWN):There's no support down there. The denominator is very small base mobility. Very few throws keep prices falling。
After the crash, the mess:Through the evolution of these three mathematical models, the conclusion is very cold: the K-line, after the collapse, is essentially an asymmetrical space “upward gravity” (set of resistance) and down to the infinite small (mobility vacuum).” Any rational quantitative algorithm and manipulator, after calculating the cost of C {text{recovery}, simply abandons the "second-down" script。
Chapter 4: The limitations of models - three lethal reality variables beyond mathematics
To be honest, can mathematical models alone predict and reverse the entire crash? No。
The financial engineering community has a wise saying from george box: “All models are wrong, but some are useful.”
MANY OF THE MODELS MENTIONED EARLIER (LPPLS, JUMPING SPREAD, HAWKS PROCESS, ETC.) ARE LIKE “IDEAL STATE EQUATIONS” IN PHYSICS, AND THEY ARE EXTREMELY PRECISE IN DRAWING THE MACROBONES AND DYNAMICS OF THE COLLAPSE. HOWEVER, THESE PURELY MATHEMATICAL PHYSICAL MODELS LACK THREE OF THE MOST DEADLY REAL VARIABLES IN THE REAL, ENCRYPTED MONEY MARKET (ESPECIALLY HIGH-CONTROL, HIGH-CONTROL, HIGH-SPEED CURRENCY) IN ORDER TO “FULL AND ABSOLUTELY ACCURATE” THE ENTIRE COLLAPSE OF FLESH:
1. Order book dimensions: market withdrawal and liquidity vacuumMathematic models typically assume that there is always competition in the market and that prices are subject to continuous or semi-continuous fluctuations. But in the real “zero” process, the worst is the instant drain of mobility。
When the panic reaches its extreme, Market Maker immediately cancels all the purchase orders on Order Book in order to protect himself. At this point, the difference in the price of the trade (Bid-Ask Spread) is extremely variable:

Among them, P {text{ask} is the best price, and P {text{bid} is the best price. In the normal market \\text{Spread} is extremely small; but in the instant of a crash, the best purchase price P {text{bid} may jump directly to a few cents. At this point in time, there is a “buy-out vacuum”, and any market price bill (Market Sell) would lead to prices that ignore any support position and break through the bottom like a free fall. This requires a combination of LOB Dynamics to complete the picture。
2. Game dimension: dealer control and false transactions (Spoofing / Wash Trading)The mathematical model assumes that market participants, though crazy, behave according to statistical patterns. However, the collapse of high-controlled banknotes is often accompanied by highly centralized man-made manipulation。
-
What's going onIn the course of the fall, the dealer may suddenly put up a huge purchase price (Spoofing) below and let the scattered (or even a quantitative model) enter the floor as if it was “strongly supported” and then withdraw the bill in an instant, and the opposite hands throw their own chips at them。
It goes beyond random processes to the realm of non-cooperative Game Theory. The mathematical model does not predict the specific psychological moments when the dealer presses the Nuclear Button。
Bottom-up institutional dimensions: token economics and the “trigger” (Rug Pull)The price sequence model only looks at the facebook data, but the zeroing of many of the mackerel coins is a “downside blow”。
This instant “inflation to zero” is entirely independent of market sentiment when the projector suddenly unlocks the daily tokens directly or when smart contracts are exploited by hackers. Any time-series model derived from historical prices is ineffective in the face of an absolute increase in chips。
Summary
We have a mathematical model that perfects the greed (foam period), panic (jumping period) and trampling (terms of serial explosion). But that's just the side of the coin. To be truly 100% accurate, statistical models need to be combined with the Order Flow and the dealer's game matrix, which is an extremely complex multi-dimensional system project。
In these unsupported funds, high prices are never a manifestation of value, but an illusion of liquidity manipulation. From the exhaustion of mobility in the Kyle model, the constant blood-sucking of the money rate, the positive feedback cycle of the serial burst, the inevitable betrayal of prisoners' plight, to the instant collapse of the mobility vacuum, the collapse of the LPPLS macro-foam, the micro-stamp of the Hawks process, and the mathematical resistance of the chasm of the pallet after the collapse, each of which is the result of a precise calculation。
The bottom logic is not understood to “winner the dealer” in the next fund pool, but to make it clear from your bones that in this game, the bulk is not a player from the beginning, but a fuel。
