
Tiger Research: Down to 2026 Q2 bitcoin valuation
THE BITCOIN Q2 VALUATION HAS BEEN REVISED DOWNWARDS TO 14.3 MILLION, WITH A POTENTIAL OF TWO TIMES: TO MOVE FROM OVERFALL TO EARLY EQUILIBRIUM. 。

Key points
The present report is submitted byTime ResearchWritten。THE MACRO-ENVIRONMENT REMAINS SUPPORTIVE, ALBEIT AT A SLOWER PACE: THE GLOBAL M2 IS AT A RECORD HIGH OF $13.44 TRILLION, WITH BITCOIN ETF FLOWS TURNING NET FOR THE FIRST TIME IN 14 MONTHS. HOWEVER, THE OIL SHOCK CAUSED BY THE IRANIAN CONFLICT PUSHED THE CPI UP TO 3.3 PER CENT IN MARCH, NARROWING THE FED'S INTEREST-RATE PATH。
Indicators in the Bitcoin chain are moving from underestimation to early equilibrium: indicators in the key chain have moved out of the panic zone in the first quarter. The current price is $7.05 million, and the average entry cost for longer-term holders is $7.88 million below approximately 13 per cent. Breaking that level will be the main signal of the reversal of short-term trends。
The target price of US$ 14.3 million and the two-fold increase in space remain valid: adjustments based on a neutral benchmark of US$ 13.25 million, superseding basics - 10 per cent and macro + 20 per cent. While the target of $18.55 million was lower than the target for the first quarter, a significant reversal of spot prices meant that the real increase in space at current prices had instead increased。
Macrowind is still on, but kinetic energy is slowing down
Since the first quarter of the report, Bitcoin has fallen by about 27 per cent, with average prices hovering around $7.05 million at the beginning of April. The Iranian conflict introduced a new variable, but the overall macro-environment remains favourable. Change is not direction, but speed。
It's a record level of liquidity, but it's not effectively transmitted to bitcoin
AS OF FEBRUARY 2026, THE GLOBAL M2 CONTINUED TO EXPAND TO A HISTORIC HIGH OF NEARLY $13.44 TRILLION. HOWEVER, BITCOIN FELL 27% FROM THE FIRST QUARTER. LIQUIDITY AND PRICES ARE BEING REVERSED。
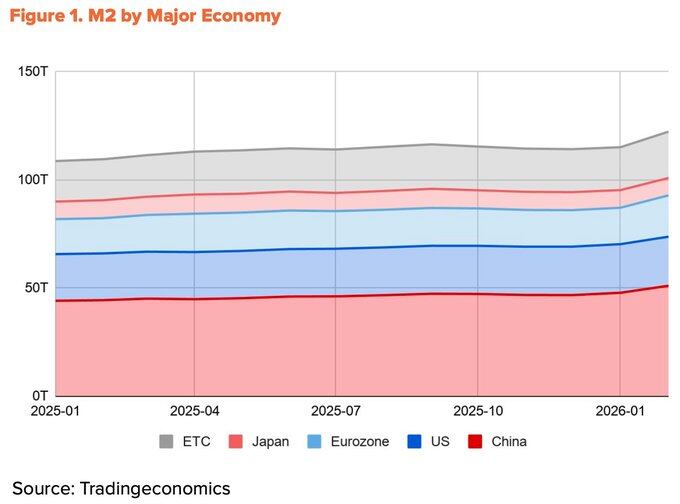
THE SOURCE OF LIQUIDITY EXPLAINS THIS DIVISION. MORE THAN 60 PER CENT OF THE M2 GROWTH IN THE FOUR LARGEST ECONOMIES (CHINA, THE UNITED STATES, THE EURO ZONE, JAPAN) OVER THE PAST YEAR CAME FROM CHINA, THANKS TO THE FALL IN THE CHINESE PEOPLE’S BANK AND THE OFFICIAL SHIFT TO A LIBERAL STANCE IN THE FIRST QUARTER。
The United States contributed only 10 per cent. The problem is that liquidity from Chinese sources has limited access to the Bitcoin market. Domestic restrictions on encrypted transactions persist, while indirect routes through Hong Kong and Singapore mainly serve institutional funds. Global liquidity is at its peak, but the share of real access to the Bitcoin market is shrinking。
The Iranian conflict slowed down the Fed's interest rate
The liquidity of the United States dollar remains the main driver of bitcoin, as liquidity transfers from Chinese sources are hampered. But even this part was delayed by the Iranian conflict。
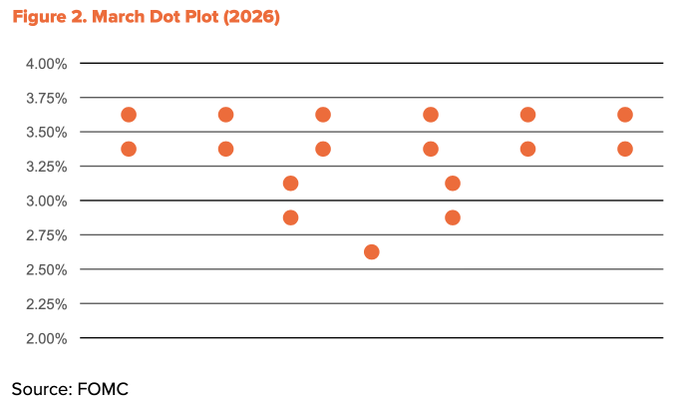
ON 28 FEBRUARY, THE STRAIT OF HORMUZ WAS BLOCKED AFTER THE ATTACK ON IRAN BY THE UNITED STATES OF AMERICA. BRENT OIL SURGED TO $118 PER BARREL IN MID-MARCH, AND DUBAI'S CRUDE OIL REACHED A RECORD HIGH OF $166 PER BARREL. THIS SHOCK PUSHED INFLATION DIRECTLY. IN MARCH, CPI ROSE FROM 2.4 PER CENT IN FEBRUARY TO 3.3 PER CENT, TWO YEARS HIGH. THE FEDERAL RESERVE'S INTEREST-RATE SPACE HAS NARROWED. THE DATE FRAME REDUCED THE INTEREST RATE REDUCTION EXPECTED IN 2026 TO JUST ONE。
Nevertheless, the easing direction has not changed. In mid-April, part of the Strait of Hormuz was reopened, and oil prices fell significantly near $90. Core CPI has stabilized at 2.6 per cent, indicating that the shock has not yet spread to the economy as a whole. At the end of January, President Trump officially nominated Kevin Warsh as the next Federal Reserve Chairman, and the Senate confirmation hearing is ongoing. Powell's term will end on May 15th, and easing will probably continue. The number of reductions may be reduced, but the direction remains the same。
Institutional flows began to reverse
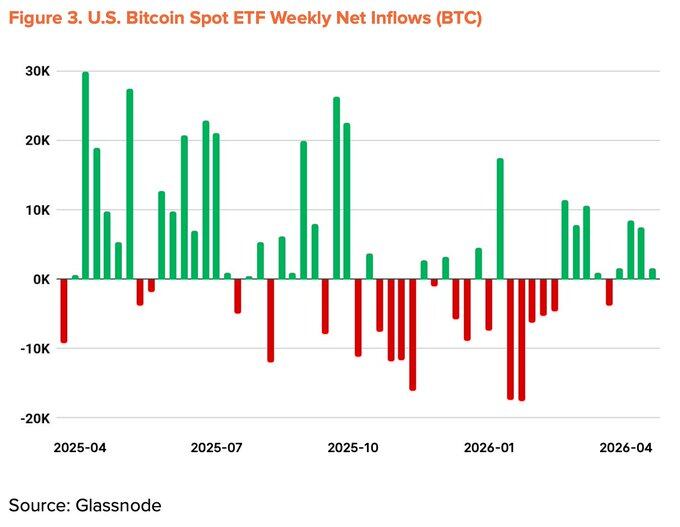
FLOWS OF INSTITUTIONS DRIVING DOWN IN THE FIRST QUARTER HAVE BEGUN TO REVERSE. THE BITCOIN SPOT ETF RECORDED THE WORST MONTHLY OUTFLOWS SINCE ITS LAUNCH IN NOVEMBER 2025 AND WAS IN NET OUTFLOWS FOR FIVE MONTHS IN A ROW. SINCE MARCH, HOWEVER, NET MONTHLY INFLOWS HAVE TURNED POSITIVE. AS OF MID-APRIL, CUMULATIVE FINANCIAL FLOWS DURING THE YEAR HAD TURNED POSITIVE AND TOTAL ASSET MANAGEMENT HAD RECOVERED TO $96.5 BILLION。
Business hoarding is also accelerating. Strategy bought 34,164 bitcoin in a single week (13-19 April) for $2.54 billion, bringing the total hold to 815,061 BTC. However, the number of companies involved in this trend has not increased significantly。
macro indicator down to +20%
THE STRUCTURAL WINDS REMAIN SOUND: EXPANSION OF LIQUIDITY, POLICY EASING, RETURN TO THE RIGHT TRACK OF INSTITUTIONAL FLOWS, AND PROGRESS ON THE UNITED STATES CLARITY BILL. THESE GAINS WERE OFFSET IN PART BY THE RECENT COUNTER-WINDS — THE OIL SHOCK CAUSED BY IRAN AND THE SLOWDOWN IN THE FEDERAL RESERVE INTEREST RATE. THE MACRO INDICATOR FOR THE SECOND QUARTER WAS REVISED DOWNWARDS BY 5 PERCENTAGE POINTS FROM THE FIRST QUARTER TO +20 PER CENT。
From underestimation to early equilibrium
The chain of indicators has moved out of areas of extreme panic and is moving towards an undervalued and balanced border. Key indicators such as MVRV-Z, NUPL and aSOPR have moved away from the first quarter panic zone to the early recovery phase. While it is unlikely that there will be a significant rise in the rebound of the panic zone, historical data indicate that the average annual rate of return from the region remains at double digits. The return on risk is still in the best position at this time。
It is noteworthy that the average cost base of short-term holders (STHs) is gradually declining. This suggests that speculative funds are being withdrawn and new buyers are accumulating at lower prices. The time point is consistent with the resumption of net ETF inflows and the large-scale purchases by Strategy, supporting the judgement that institutional investors are accumulating between discount zones, thus lowering average entry costs。
The critical risk level is $54,000, or the average cost base for the entire network. Breaking that position would put the entire network into an unrealized loss and become the bottom of an extreme scenario. The strongest resistance position is $78,000, which coincides with the average entry costs of long-term holders。
The current price, $7.05 million, is approximately 13 per cent below that resistance level, and significant short-term inflows of funds are in unrealized deficit. A decisive breakthrough of $78,000 in the short term deserves close attention。
Surface growth, bottom stagnation
The average daily turnover of bitcoin in the first half of the month was 56.64 million, an increase of 37.9 per cent. The surface data is bright, but the details tell another story。
DURING THE SAME PERIOD, THE NUMBER OF ACTIVE ADDRESSES FELL TO 42.88 MILLION, A DECREASE OF 13.2 PER CENT OVER THE SAME PERIOD AND 4.2 PER CENT OVER THE RING. THE AVERAGE SIZE OF INDIVIDUAL TRANSFERS FELL TO 1.19 BTC, DOWN 34.1 PER CENT FROM THE PREVIOUS QUARTER. THE NUMBER OF TRANSACTIONS HAS RISEN, BUT BOTH PARTICIPANTS AND INDIVIDUAL VALUES HAVE DECLINED. THIS MODEL REFLECTS REPEATED SMALL TRANSFERS BY A SMALL NUMBER OF USERS RATHER THAN EXTENSIVE ECONOMIC USE OF THE NETWORK. A SIGNIFICANT PART OF THE INCREASE IN TRADE VOLUMES MAY COME FROM MECHANICAL FLOWS SUCH AS THE EXCHANGE ' S FILLING, UNRELATED TO REAL GROWTH。
The first quarter report maintained the basic indicator at 0 per cent, based on expectations of BTCFi ' s ecological expansion. In the second quarter, this argument was significantly weakened. According to The Block 2026 Digital Asset Outlook, Bitcoin L2 TVL has fallen 74 per cent during the year, and BTCFi total TVL has fallen 10 per cent, representing only 0.46 per cent of the total supply of Bitcoin (91,332 BCC). Although individual agreements such as Babylon and Lombard have grown, the ecosystem as a whole has contracted。
Base indicator down to -10%
The apparent growth has not translated into real network expansion, and the underlying data underpinning the BTCFi argument has weakened. The balance of positive and negative signals offsets in the first quarter has been broken. Second quarter fundamental indicator down from 0% to bottom - 10%。
Target price, $143,000. There's still two times the increase
USING THE TVM METHODOLOGY, THE NEUTRAL BENCHMARK AT THE AVERAGE PRICE AT THE BEGINNING OF APRIL 2026 WAS $13.25 MILLION. THE 12-MONTH TARGET PRICE WAS SET AT US$ 143,000, ADJUSTED BY SUPERSEDING BASICS - 10% AND MACRO + 20%。
This figure is approximately 23 per cent below the target of $18.55 million for the first quarter. However, the potential for real increases has expanded. In average prices, the upper space was expanded from +93 per cent in the first quarter to +103 per cent in the second quarter。
The lower target price does not represent pessimism. Macro orientations and chain structures continue to support medium- and long-term cattle market logic。
Three short-term observation points:
- Decisively breaking the mid-term balance of $78,000 across the network
- ETF CONTINUED NET INFLOWS
- The Federal Reserve policy shifted when geopolitical risks were mitigated。
If these three conditions are met simultaneously, the $143 million target remains achievable。
