
Data study: How much is the difference between Hyperliquid and CME crude oil liquidity
Hyperliquid has touched the door to the price of crude oil。

Original author/Castle Labs
Compile / Odaily Daily Planet Golem()@web3 golemI'm not sure
The authors followed this paper by systematically examining the differences in crude oil contract transaction data between Hyperliquid and CME during working days and weekends and drawing some important conclusions. At present, Hyperliquid does not match CME in absolute indicators such as liquidity depth or slide points, with less than 1 per cent overall liquidity, which is related to the fact that the main user of the RWA trading platform is still the encrypted original bulk。
Hyperliquid differed from the apparent increase in the scale of crude oil contract transactions over the weekend period。This suggests that, in addition to the speculative needs of the diaspora, traders who want to gain access to crude oil trading and hedge operations by Monday are also trading on Hyperliquid。And this trend is becoming increasingly apparent, which has enabled Hyperliquid to have the ability to discover the prices of bulk commodities。
However, for institutional investors, the high transaction costs of the Hyperliquid platform, compared to CME, remain a major obstacle to its expansion in the area of bulk commodity trading. If Hyperliquid does not improve its ability to process institutional orders as soon as possible, it can only be a temporary place for traditional traders to trade on weekends and, ultimately, a small addition to the traditional financial landscape。
Research methodology and data sources
This analysis assesses the microstructure of the crude oil market through two studies, covering the work day and weekend markets respectively, and using cross-cut data from two trading locations: Xyz: CL Sustainable Contract (CME) and CLJ6 (NYMEX WTI crude oil futures) Contract (in April 2026), respectively。
CME data is from Databento transactional data source, which captures transactional data rather than order book snapshots. Therefore, all CME depth and slide point estimates are based on actual exchange rather than quoted depth. Hyperliquid data is derived from a publicly available S3 database of Hyperliquid that contains a complete chain transaction log。
SoThe analysis of both trading sites is based on actual turnover。ALL DEPTH DATA REPRESENT EXPLICIT LIQUIDITY, I.E. THE TRADE WITHIN A SPECIFIC BASE POINT IN THE VWAP INTERMEDIATE PRICE OF 5 MINUTES WINDOW, RATHER THAN THE COMPLETE QUIET DEPTH ON THE ORDER BOOK。
Research cycle and market context
The research cycle, 27 February to 16 March 2026, coincided with the geopolitical turmoil following the Iranian attack of 28 February 2026。
- PRE-ATTACK MARKET CLOSING: LAST CME TRADING DAY BEFORE THE ATTACK。
- On Monday, opening: the market was under great pressure, CME stock prices jumped sharply, while the Hyperliquid xyz: CL market was constrained by perceived borders。
- The following weekends: due to high oil prices, market volatility led to high volumes of crude oil traded on the Hyperliquid platform。
xyz: CL came online in early 2026, meaning that the three weekend observation periods covered the early stages of maturity of the Hyperliquid market. The observed trends, including higher levels of liquidity, increased transaction volumes and increased number of users, partly reflect the maturity of the market. But..We don't think chain exchanges are currently comparable to traditional exchanges on absolute indicators such as liquidity depth or slide points. BeautifulI don't know。
The objective of our research is to track directional trends: whether the price differentials are narrowing, at what pace and under what conditions。
Data analysis
The data analysis is divided into two parts by time period:
- Workday hours: Covers the full three-week period, comparing the depth of the working-day hours of Hyperliquid and CME, the slide point and the premium/discount on the transactions of the two exchanges. For Hyperliquid, we have also analysed its financing rates over the entire period。
- Weekends: Within the given period, including three weekends, we analyzed the price discovery and the price gap deviation of Hyperliquid against CME openings。
Analysis of working-day data
This analysis covers the full three-week period, focusing on the period during which both exchanges are active。
Liquidity depth is measured in United States dollar transactions within the range of the VWAP intermediate values ± 2, ±3 and ±5 basis points per 5 minutes and is aggregated in medians for all working days. As noted above, this reflects intra-temporal trade, rather than silent quotation depth. This approach may underestimate the depth of CME and Hyperliquid liquidity。
THE EXECUTION SLIDE POINTS WERE ESTIMATED USING A SYNTHETIC ORDER BOOK IN ORDER OF PRICE. FOR EACH 5-MINUTE PERIOD, THE OBSERVED RECORD OF SINGLE-SUM DEALS IS IN ASCENDING ORDER OF PRICE (SIMULATION OF SALES ORDERS) AND IN ORDER TO REACH THE TARGET ORDER. THE ARRIVAL PRICE IS SET AT THE LOWEST AGREED PRICE WITHIN THAT TIME PERIOD (WHICH REPRESENTS THE BEST SELLING PRICE UPON ARRIVAL OF THE ORDER). THE SLIDE POINT CALCULATES THE DIFFERENCE BETWEEN THE WEIGHTED AVERAGE PRICE (VWAP) FOR THE TRANSACTION AND THE PRICE ARRIVED, EXPRESSED AS A BASE POINT. THIS METHODOLOGY WAS APPLIED TO ORDERS OF AN INCREMENTAL NATURE RANGING FROM $10,000 TO $1 MILLION。
Hypeliquid-CME base difference for working day hours: track the symbolic price difference between the Hyperliquid intermediate and the CME latest price in a window of 5 minutes for all working day hours. This reflects any structural premium or discount for Hyperliquid in active time relative to CME reference prices. The Hyperliquid intermediate price is derived from the trade-weighted average price (VWAP) that was traded every 5 minutes of trading time, rather than from a real-time order book offer。
The Hyperliquid financing rate is hourly and the financing rate is hourly base point。
Weekend data analysis
THIS ANALYSIS FOCUSES ON CME'S THREE DIFFERENT WEEKEND BREAKS:
- W1:2026 28 FEBRUARY-1 MARCH
- W2:2026 7 MARCH-8 MARCH
- W3: 14 MARCH - 15 MARCH 2026
In W1 and W2, Hyperliquid's contract is restricted and therefore the price of the mark cannot exceed the “inter-zone limit boundary” (DB)。THE AGREEMENT EFFECTIVELY LIMITS PRICES TO A NARROW ZONE WHEN THE MACHINE PRICE IS FORECASTED TO FREEZE (E.G. WHEN THE MAIN REFERENCE MARKET (CME) IS CLOSED AND EXTERNAL PRICE DATA SOURCES STOP BEING UPDATED)。
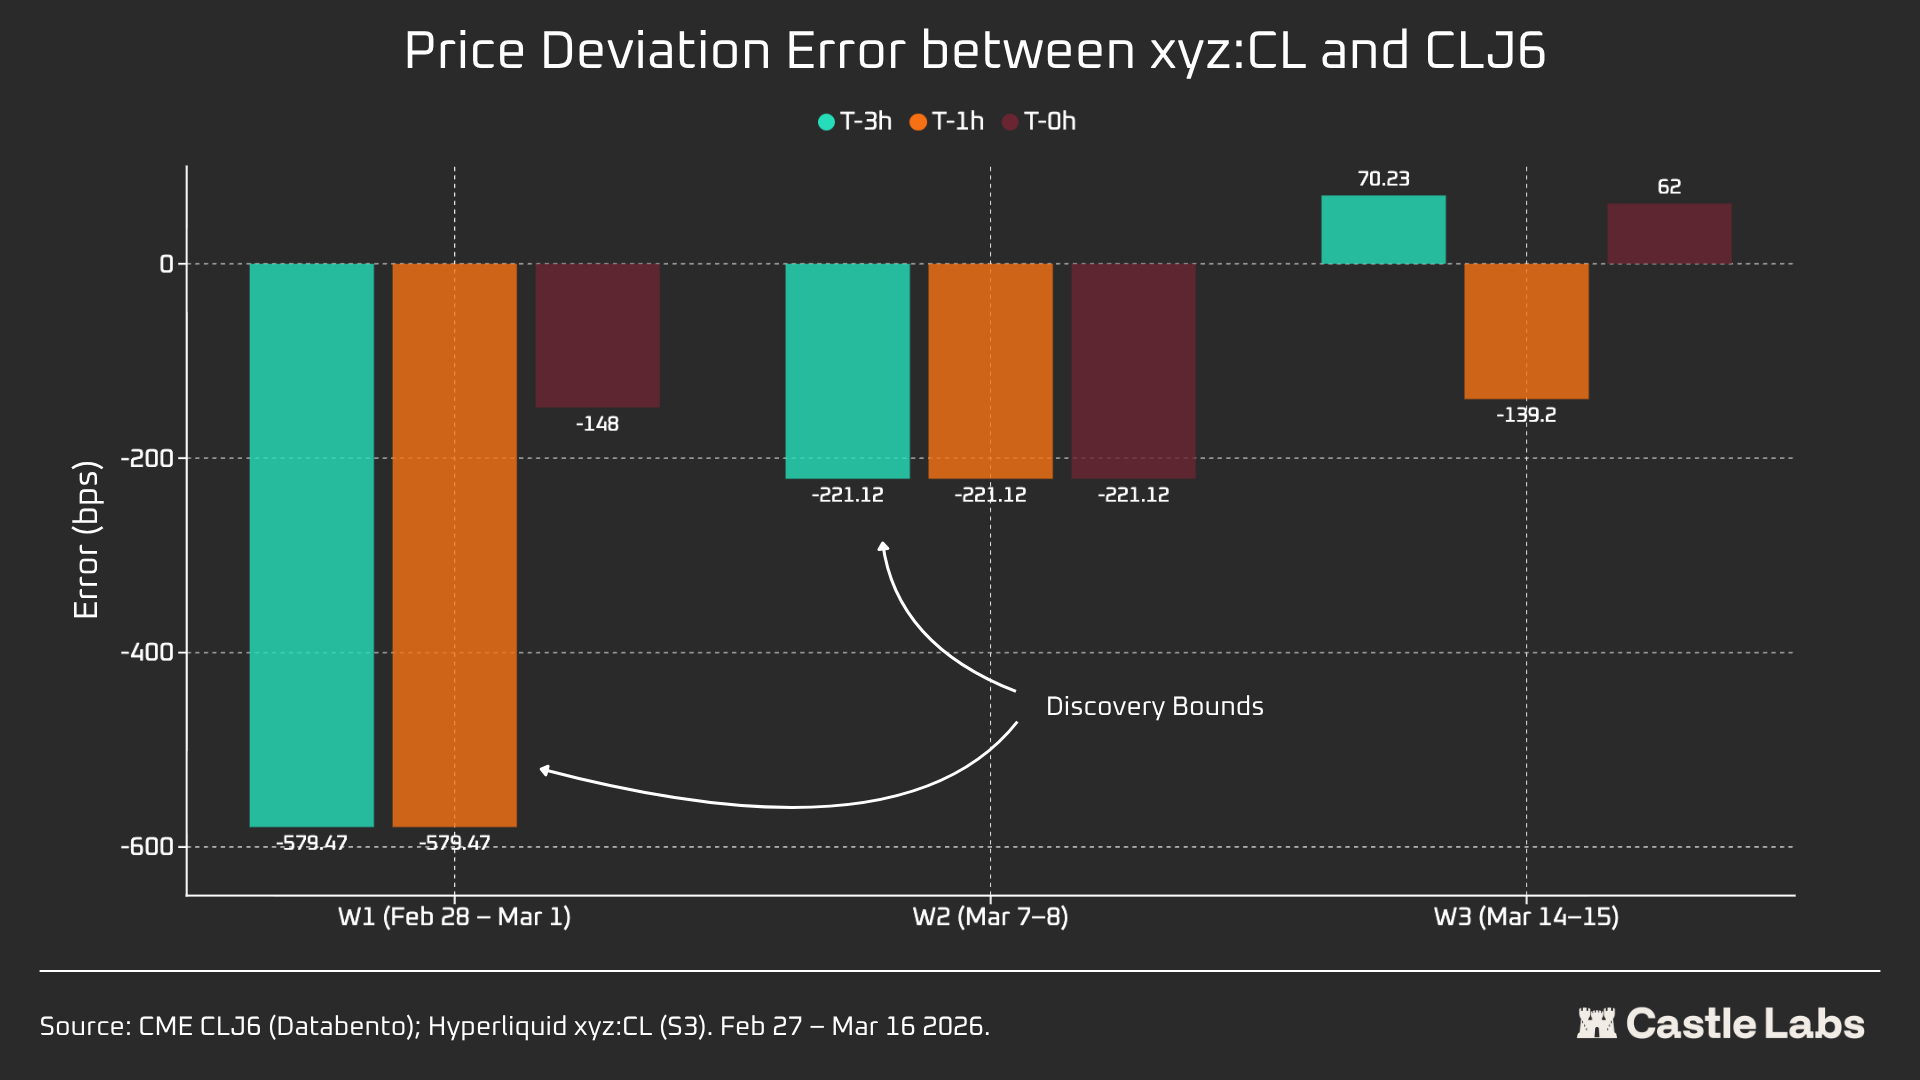
For each weekend window period, we report key data indicators for Hyperliquid xyz: CL, including prices, turnover and number of transactions. In order to measure the difference between the price differentials of Monday's opening, each weekend we measure the price gap between Hyperliquid and CME at three reference points:
- 3 HOURS BEFORE CME RESET
- CME 1 HOUR BEFORE RESET
- CME ON OPENING (T=0)
All price differentials are expressed as basis points, positive values are expressed as Hyperliquid higher than CME openings and negative values as discounts。
Quantitative analysis
This section begins with an analysis comparing the liquidity of the crude oil market at Hyperliquid xyz: CL HIP-3 and NYMEX CLJ6 during the overlap of working days。
Liquidity depth: less than 1% of CME by Hyperliquid
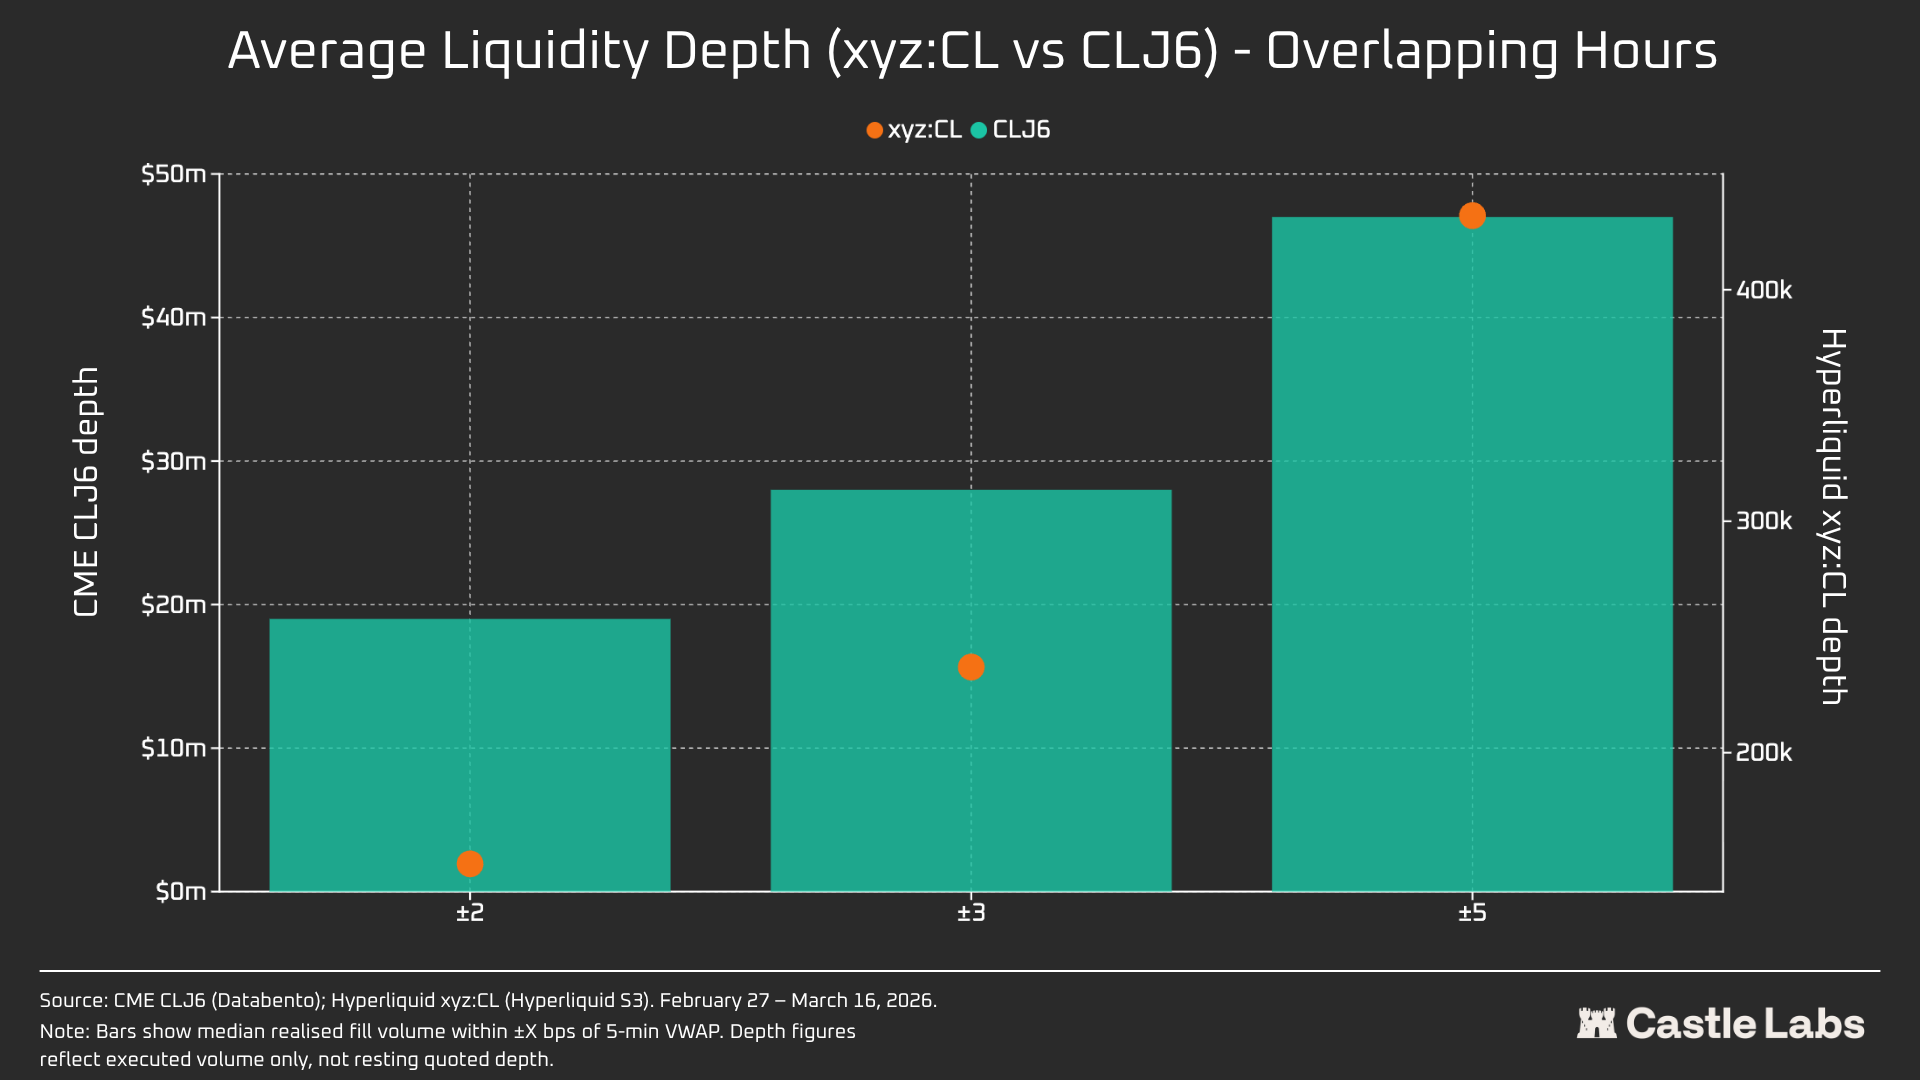
THERE IS NO DOUBT THAT THE LIQUIDITY OF THE CHAIN EXCHANGE IS QUITE DIFFERENT FROM THAT OF CME。The average liquidity depth of CL on Hyperliquid is less than 1% of CLJ6 and is consistent between the price ranges (109 times at ±5 bps)。Within the middle point ±2 bps, CME has an enforceable depth of $19 million, while Hyperliquid is only $152,000, a difference of 125 times。
This result is not surprising given the novelty of the CL market on & nbsp; Hyperliquid and its different target user groups. The main value of chain exchanges is to provide unlicensed channels of dealing to users who are traditionally excluded from such institutions as CME。
However, as awareness of these platforms begins to shift with the growth of trade volumes on weekends such as Hyperliquid, institutional investors are increasingly interested in matching positions during non-trading times, and it becomes increasingly important for Hyperliquid to create a market environment suitable for traditional investors and the diaspora。
THIS COST GAP IS NEGLIGIBLE FOR BULK TRADERS WITH A TURNOVER OF $10,000. HOWEVER, THE CHAIN COSTS OF CL (AND MOST OTHER MARKETS) REMAIN UNSUSTAINABLE FOR INSTITUTIONAL INVESTORS WITH TRANSACTIONS EXCEEDING $1 MILLION。
In fact, the inherent differences among user groups are reflected in the medium-sized scale of transactions during these overlapping periods。
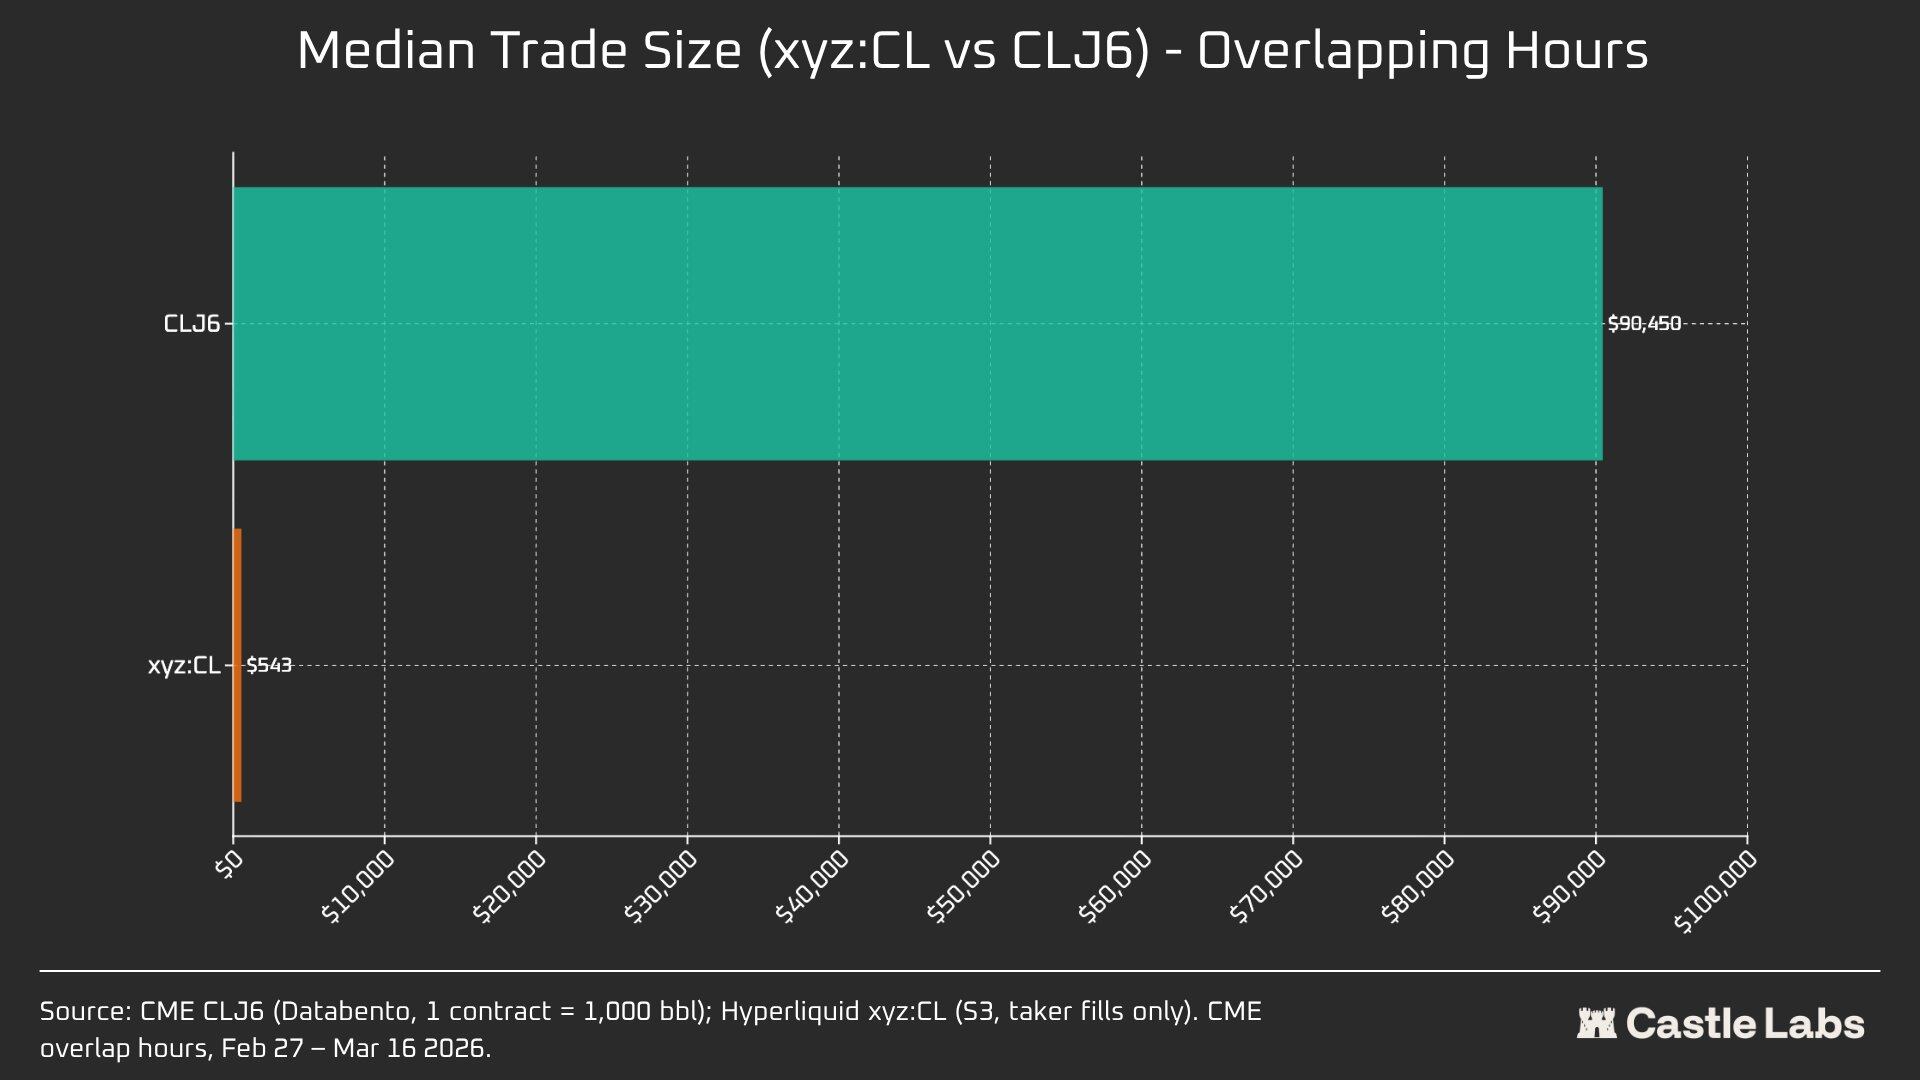
the difference of 166 times the medium scale ($90,450 vs. $543) is the clearest proof of the fundamental differences in the user groups serving these trading sites。The median trade of CLJ6 is equal to that of a standard crude oil futures contract (with a nominal value of approximately $94,000 at current prices), while the median trade of Hyperliquid is $543, reflecting leverage-directional bets by original bulk traders of encrypted currency。
We anticipate that, as these markets become increasingly legitimized in the eyes of more traditional investors and transfer funds to chains, the middle trading scale of the Hyperliquid commodity market will turn the corner。
In order to further differentiate the size of the transaction, we conducted a simulation of the order, which ranged from $10,000 to $1 million。
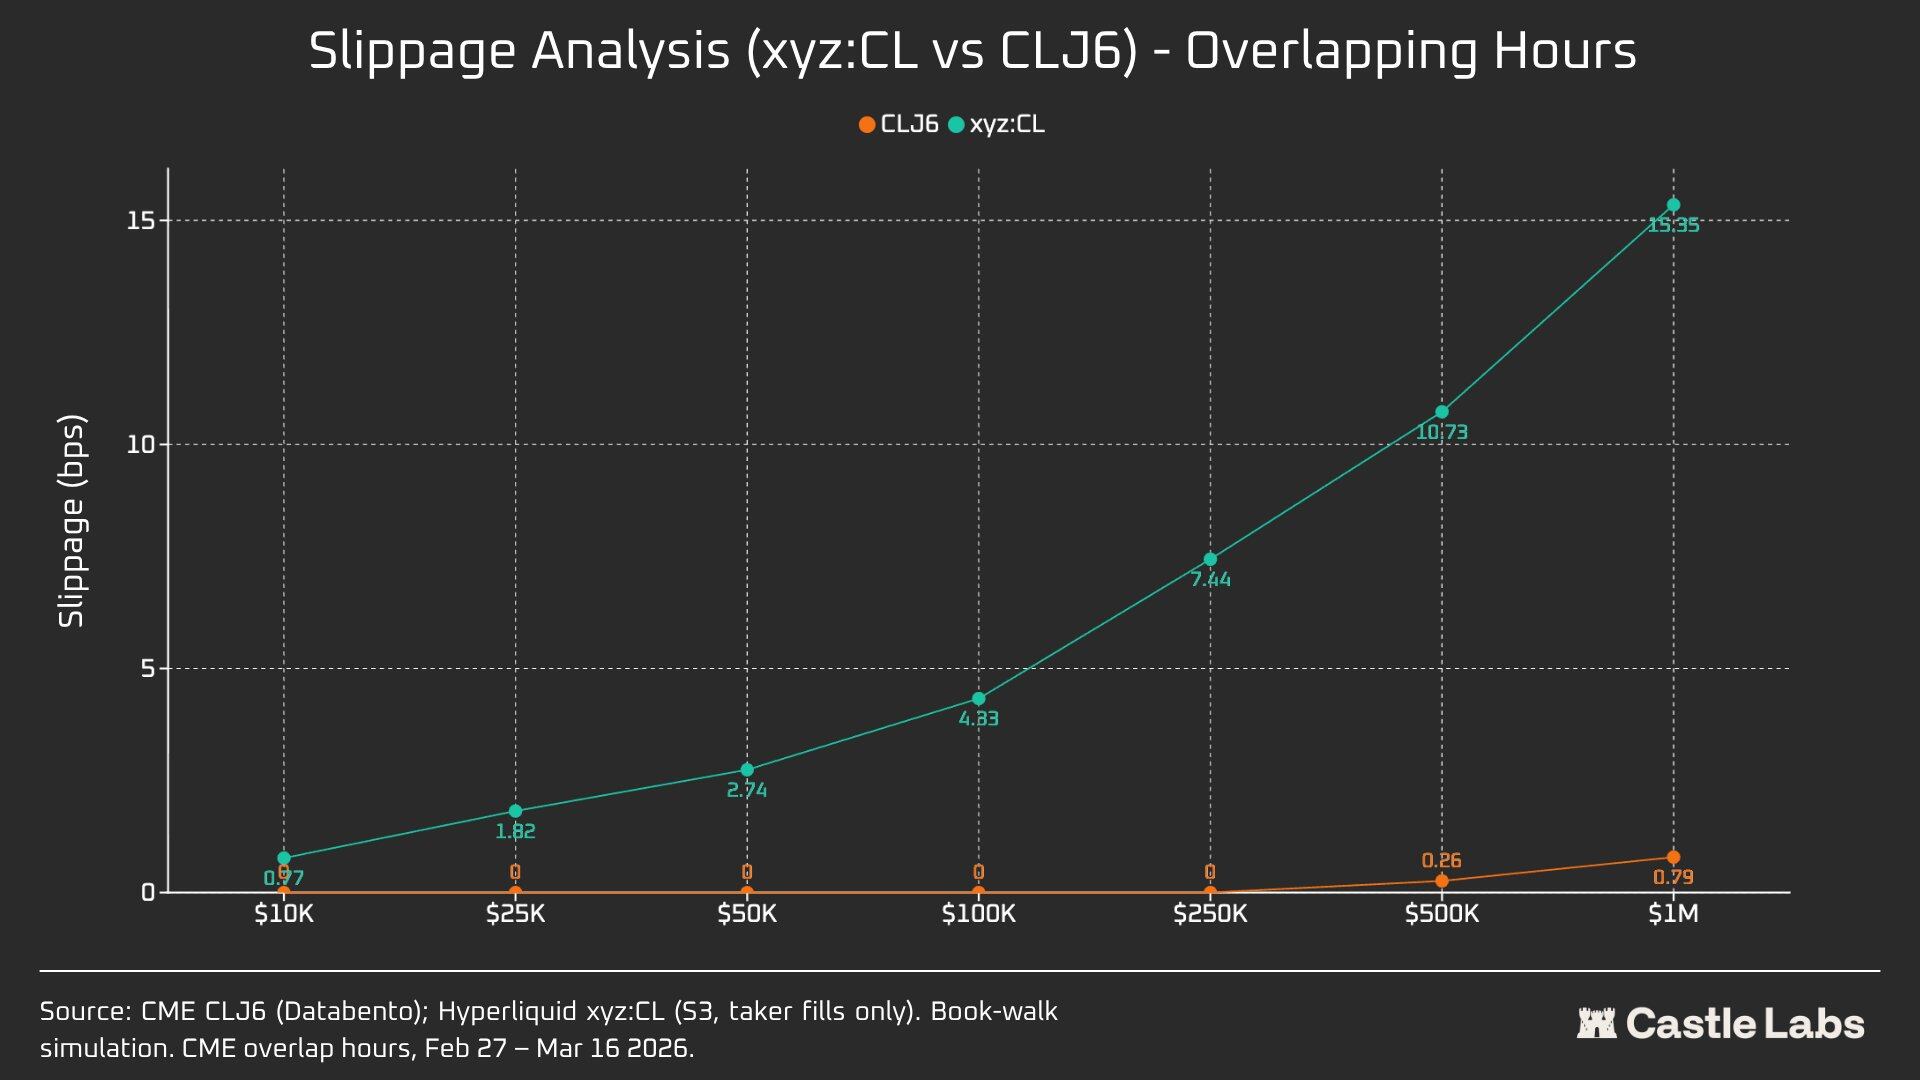
For the $10,000 order, the CLJ6 trader does not have a slide point, which is consistent with expectations, while the median execution point for Hyperliquid users is less than 1 basis point, 0.77 basis points. The gap appears on an order of $100,000, at which point the slide point for Hyperliquid users rises to 4.33 basis points, close to the threshold of 5 basis points, while CME CLJ6 has no slide point。
IT IS NOTEWORTHY THAT THIS IS HIGHER THAN THE MEDIAN TRANSACTION SIZE IN THE CLJ6 MARKET ($90,450)。
At a scale of $1 million, the 15.4 basis points of Hyperliquid are approximately 20 times the 0.79 basis points of CME, which confirms that the trading site does not currently have the capacity to process agency-level orders。Considering the average size of Hyperliquid, the platform is well placed to provide the same quality services to users without creating a slide point。
CLJ6 ORDERS BEGAN TO SHOW CLEAR SLIP POINTS ON THE SCALE OF TRANSACTIONS OF APPROXIMATELY $500,000, AFFECTING THEIR IMPLEMENTATION。
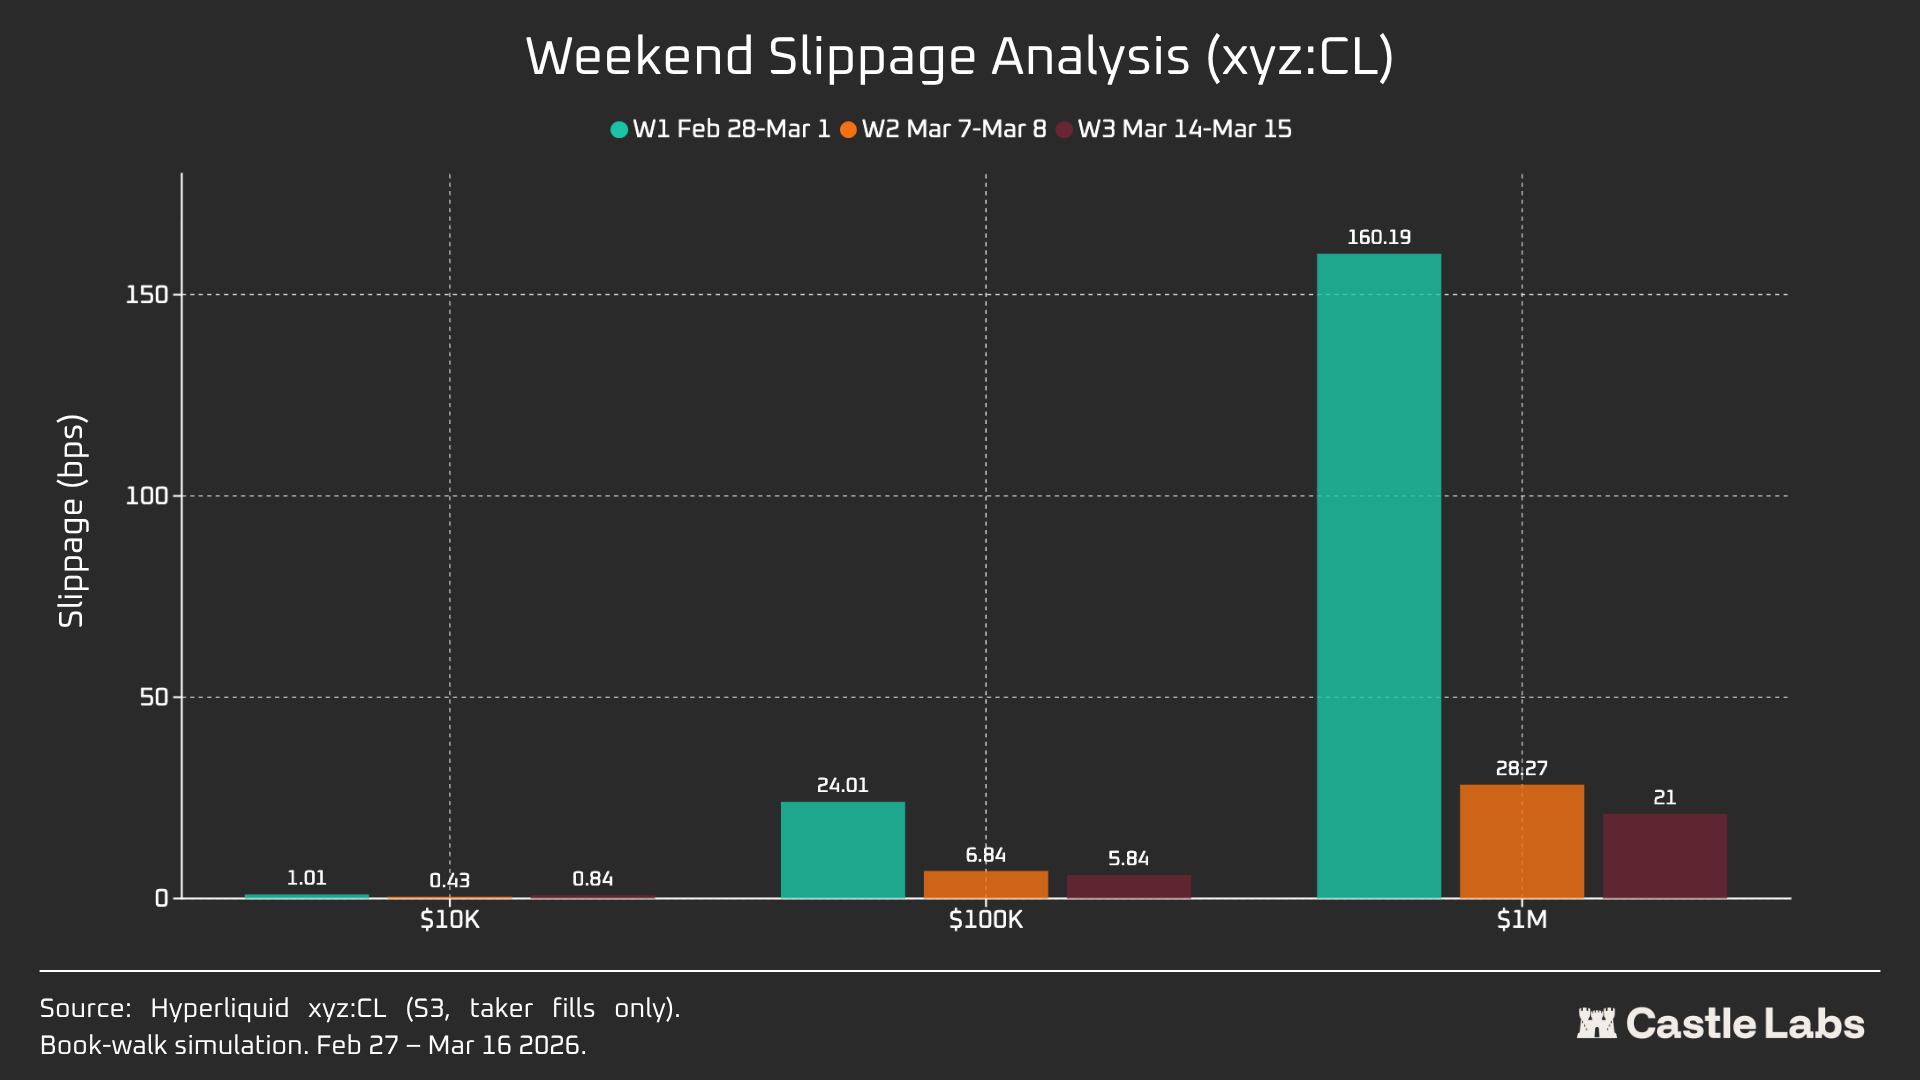
When we expanded the order size analysis to weekends, the slip points of all order sizes declined, particularly $100,000 and $1 million, indicating that the market is mature. Within three weeks of the analysis, the slide point of the simulated order fell as follows:
- $10,000:-16%
- $100,000: - 75 per cent
- $1 million: 86.9 per cent
Interest rate on financing
CL'S FINANCING INTEREST RATES FLUCTUATED MORE DURING CME CLOSING HOURS, BUT LESS DURING DELIVERY TIMES. THIS HELPS US TO REVEAL THE INTERNAL PRICING DYNAMICS OF MARKETS DURING NON-TRADING TIMES. THE WEEKEND OPENING MEANS THAT THE CL MARKET CAN USE INTERNAL PRICE DISCOVERY MECHANISMS (SUPPORTED BY DB AND OTHER RISK REDUCTION MECHANISMS). AS A RESULT, THE FINANCING RATE IS EXPECTED TO BE MORE VOLATILE, AS HIGHLIGHTED BELOW。
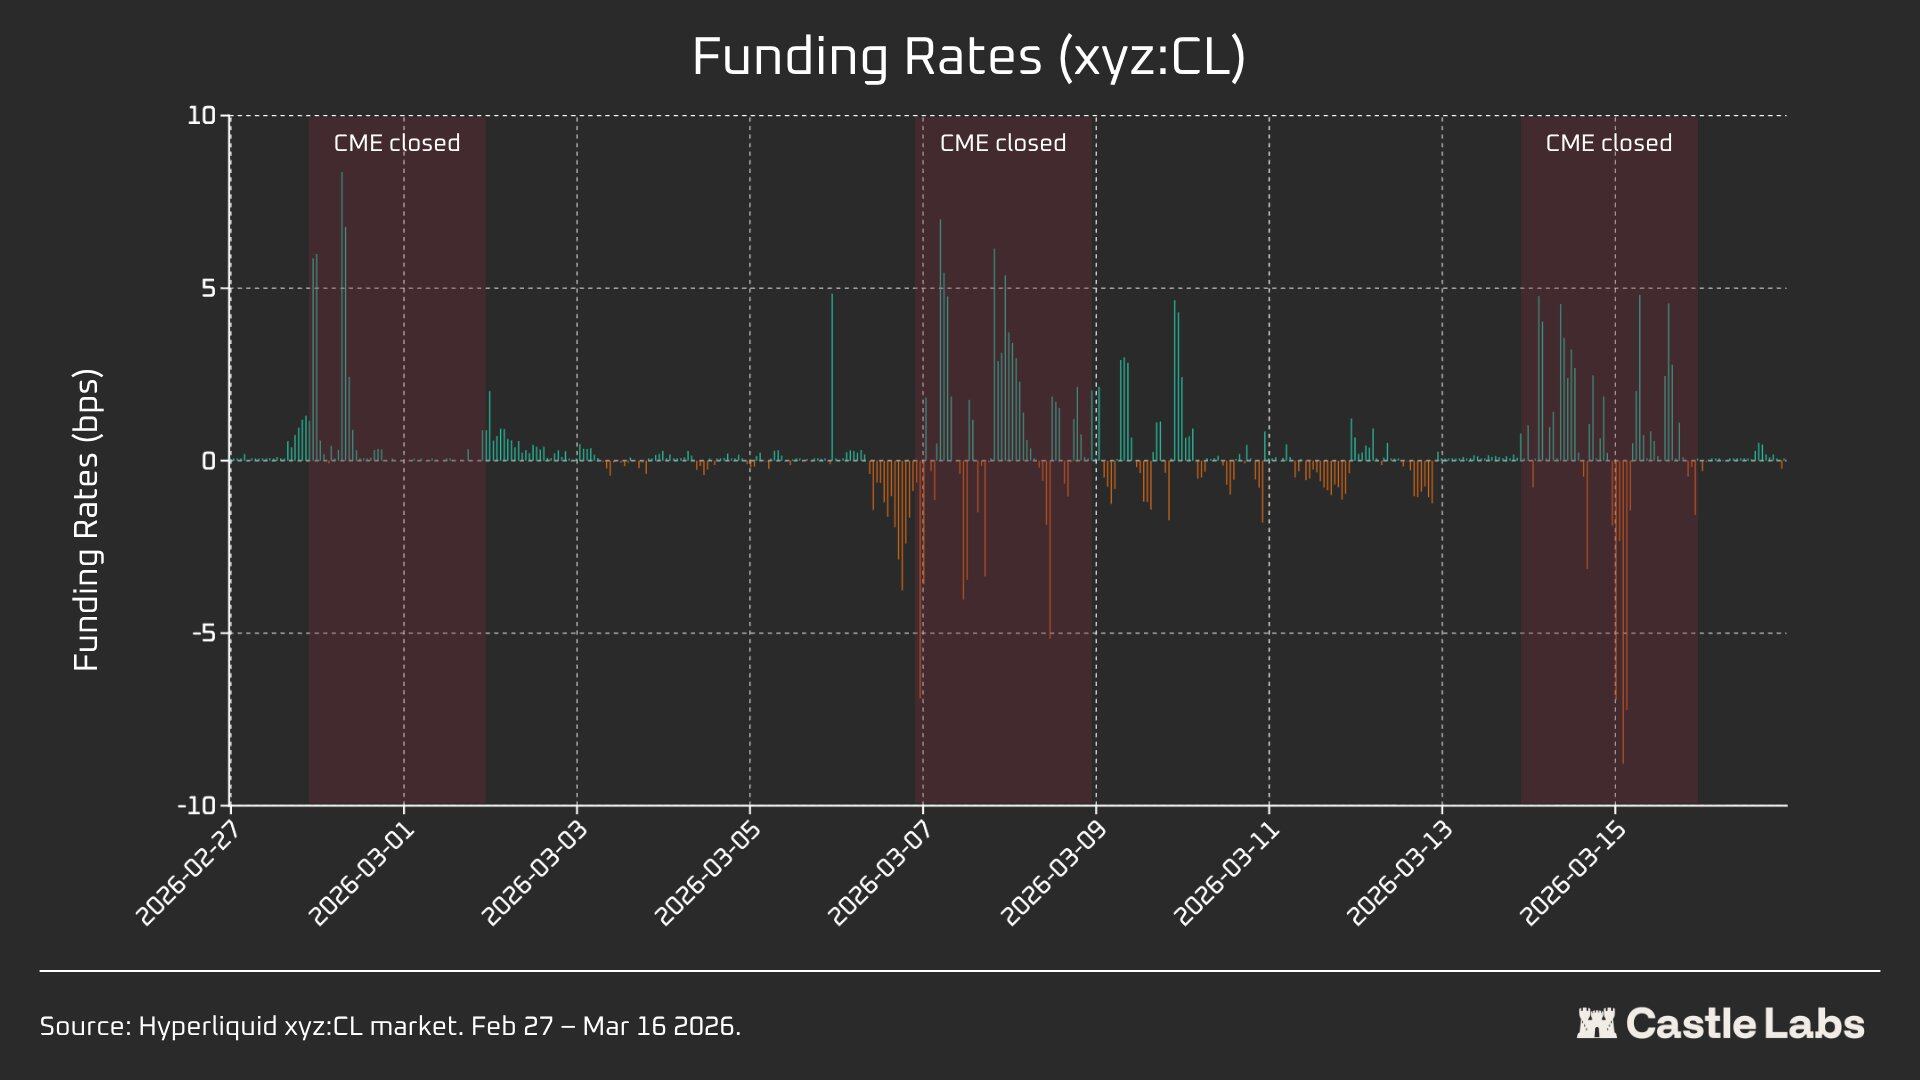
During active trading hours, Hyperliquid ' s xyz:CL is closely associated with CME ' s CLJ6 movement, but as oil prices rise, structural discounts and expansions occur, most likely due to financial interest rate pressures resulting from accumulated multiple positions。During weekends, the prices of CME, Hyperliquid, were found to be further restricted by the price inter-zone mechanism (DB), which, in the absence of real-time reference markets, limited the volatility of mark prices。
Separate analysis of weekends: Hyperliquid has price discovery capability
The three weekends have demonstrated the rapid maturity of the Hyperliquid market:
W1:2026 28 FEBRUARY-1 MARCH (IRANIAN ATTACK)
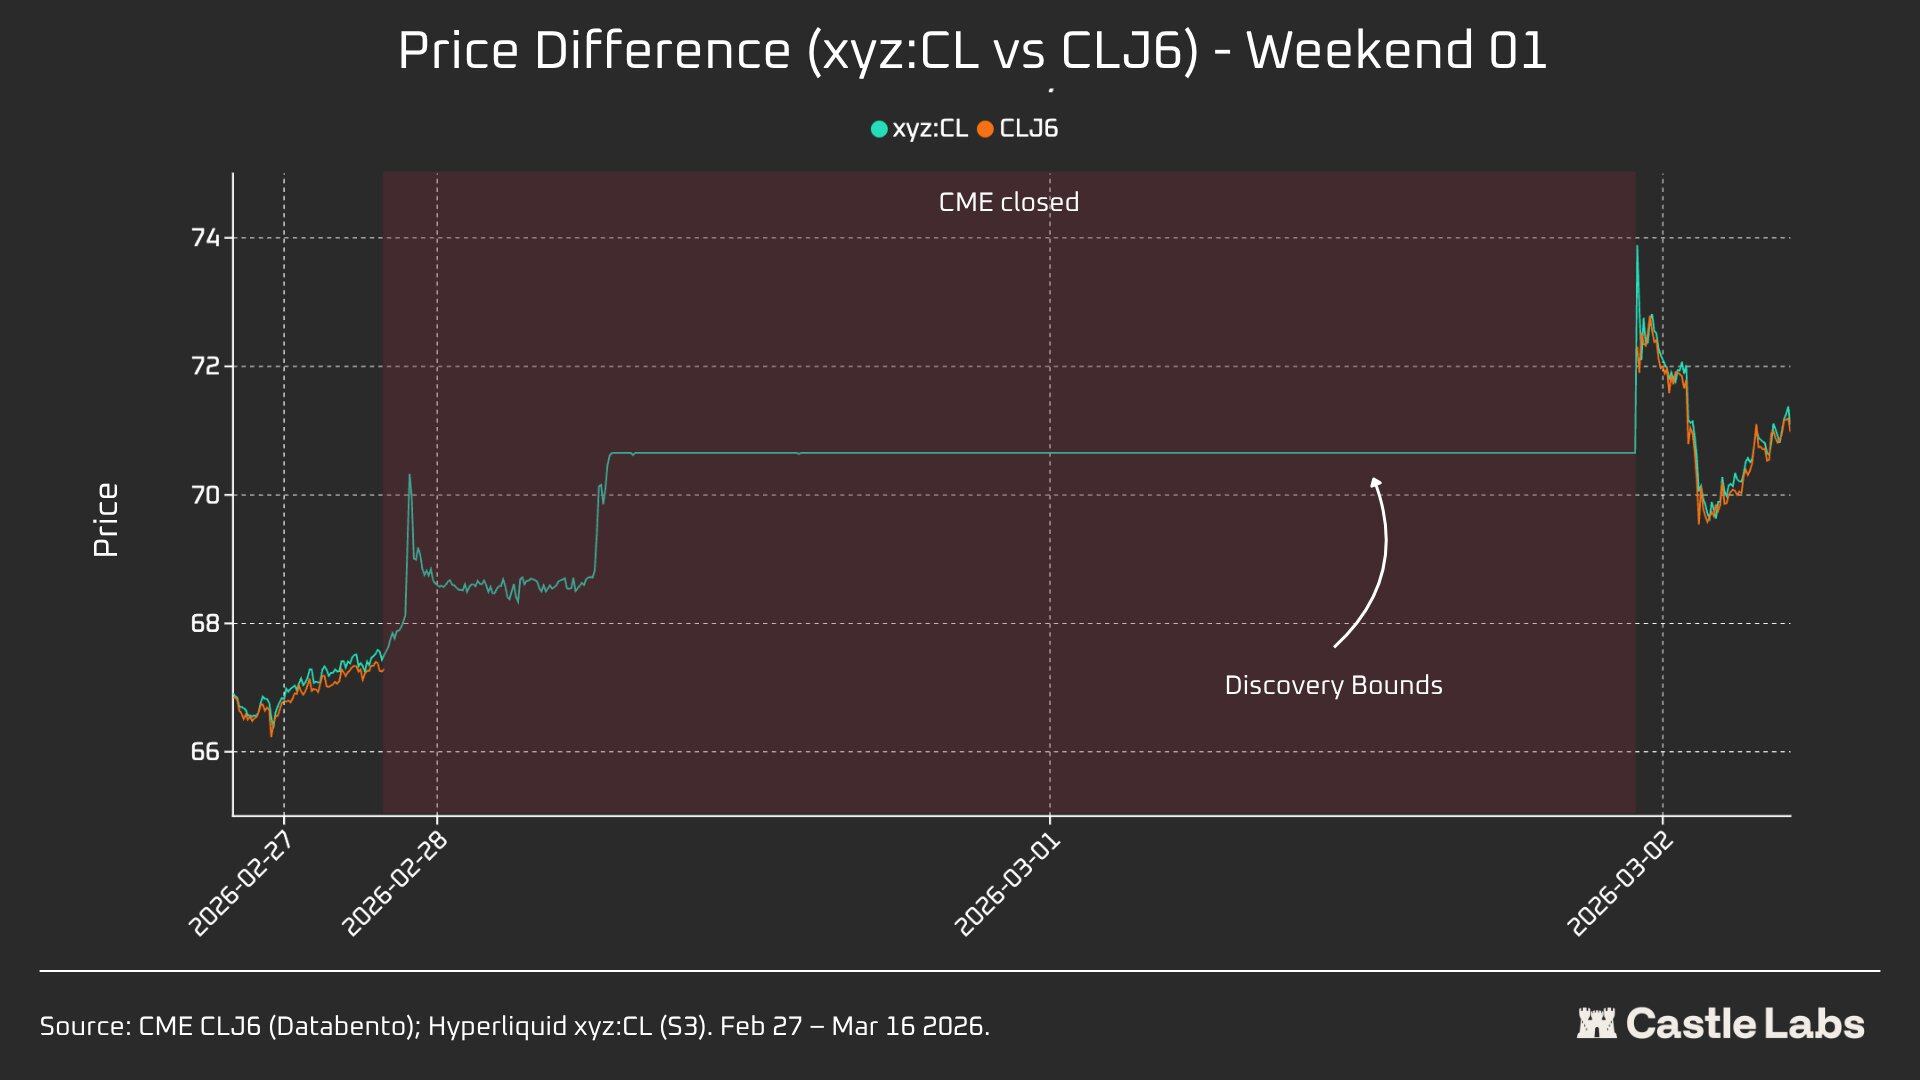
The price on Hyperliquid rose from a position close to US$ 67.29 to about US$ 70.80, or about 45 per cent (+1146 basis points) of the final jump to US$ 75 on Monday。
Particular attention is drawn to the fact that prices were found to be limited this weekend due to the above-mentioned price-limitation mechanism of 5 per cent for trade.xyz. This explains why the curves in the chart are smoother and why Monday's jump is high. Nevertheless, the difference between Hyperliquid xyz:CL ($73.89) and CME CLJ6 ($75) was within 1.5% in the first second of data release。
This is not a “fault” or “failure”, but a risk protection achieved through market design. Thus, from a data point of view, the first weekend was the least relevant, but it highlighted xyz:CL ' s response to the initial impact of Iran ' s air strikes, while also recognizing the importance of DB as a weekend price discovery mechanism, especially for emerging markets。
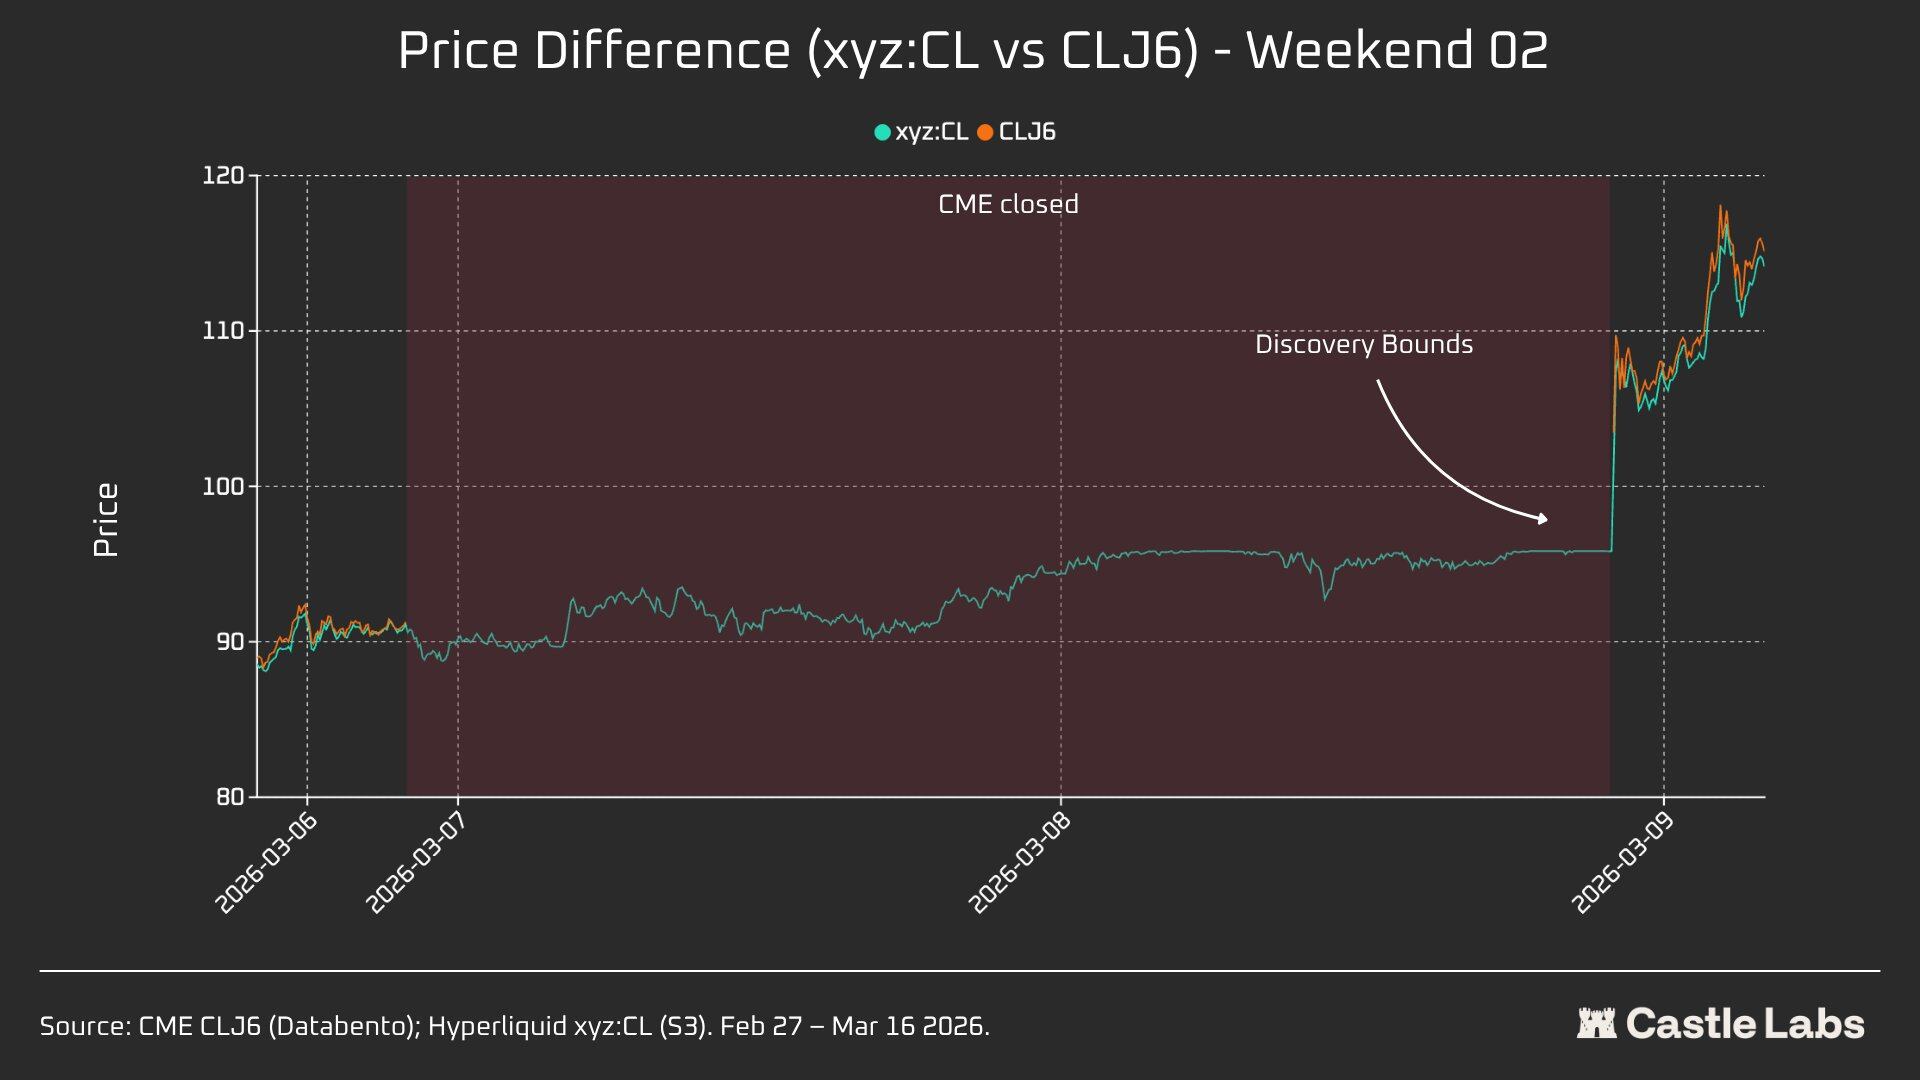
W2:2026 7 MARCH-8 MARCH
The second weekend was the real test, because xyz: CL touched the inter-border price on the market tailboard. CLJ6 opened at $98 (up 737 basis points from $92.27), while xyz:CL reached a maximum of about $9583 and captured only 68 per cent of the increase。
On the second weekend, xyz: CL better captures market trends and is closer to CME opening prices than the previous weekend。
W3: 14 MARCH - 15 MARCH 2026
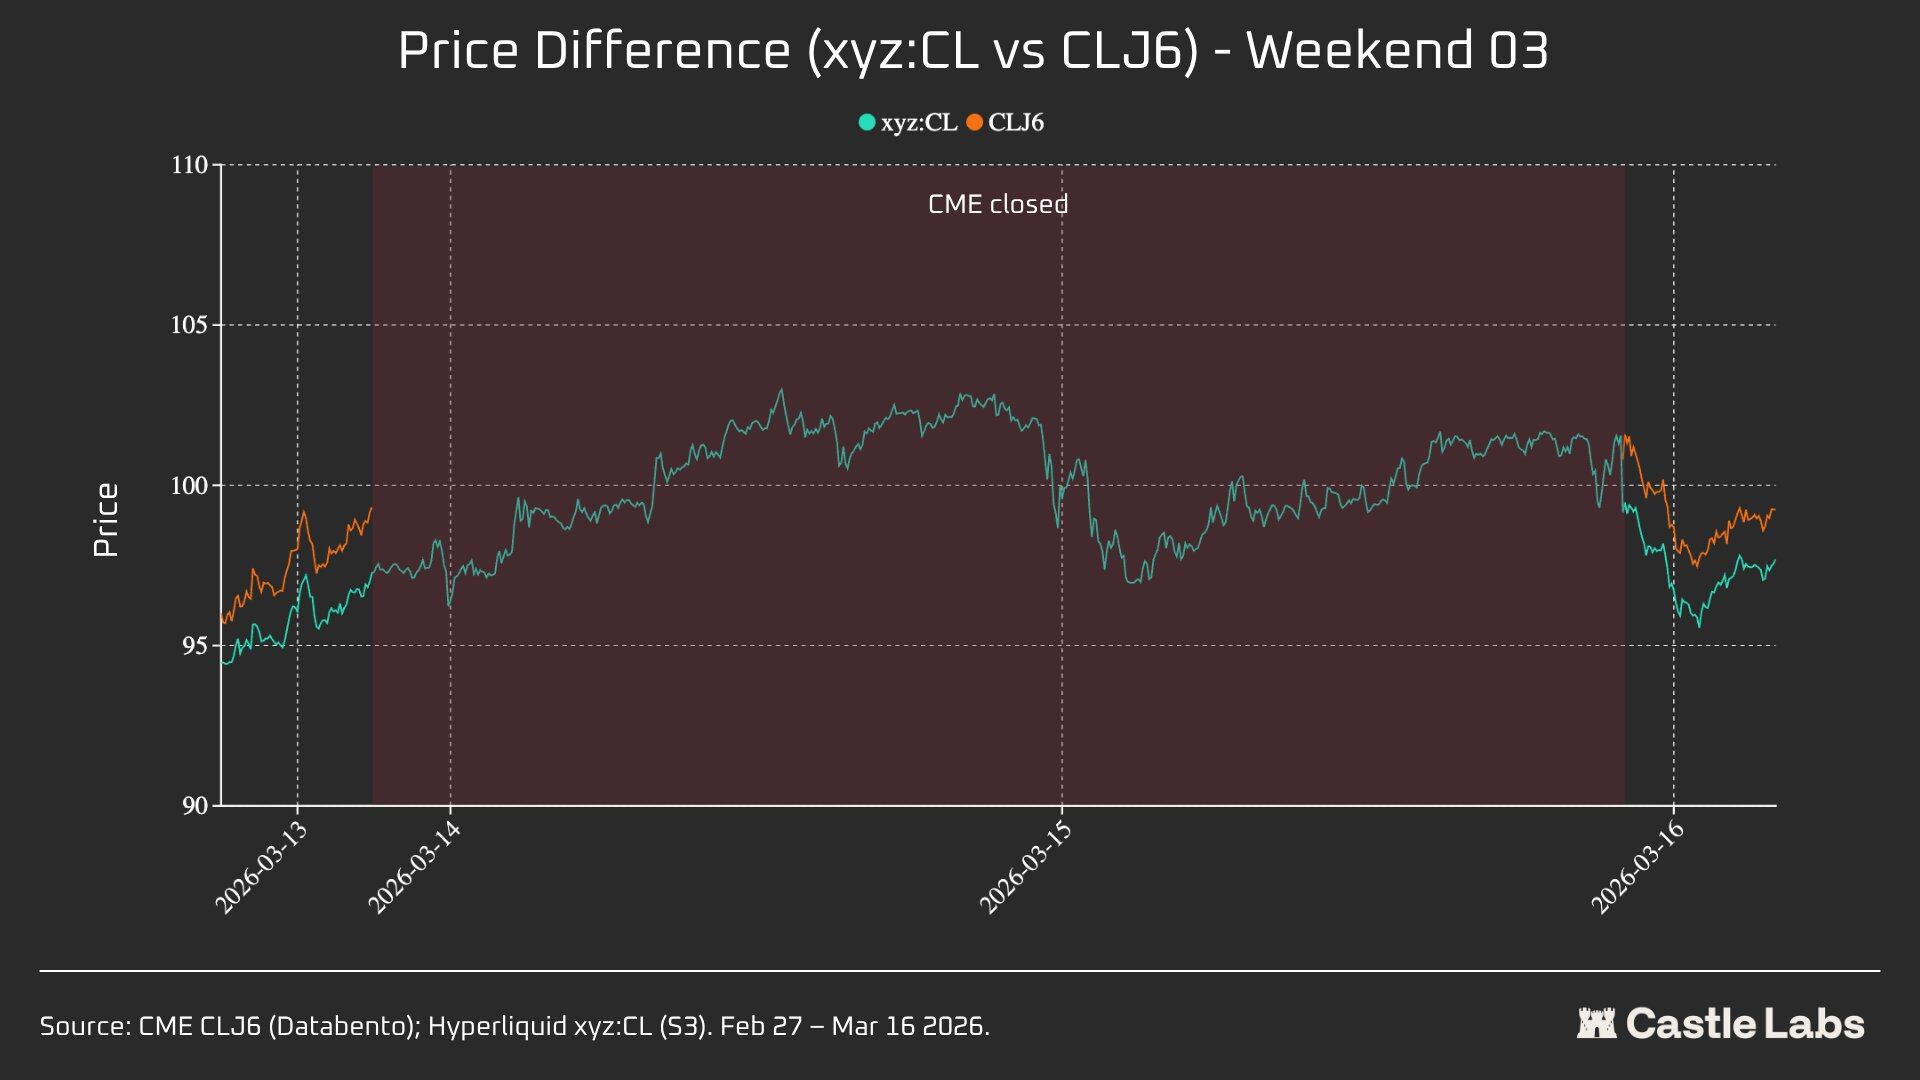
Data from the third weekend show that in a more peaceful market environment, Hyperliquid can predict more reliably the final direction of CME openingsI don't know。
Xyz: CL and CLJ6 are showing the best contraction: 226 basis points, slightly higher than the 62 basis points on Monday. CLJ6 has a closing price of US$ 99.31 on Friday and an opening price of US$ 100.93 (up 163 basis points), while xyz: CL has an opening price of US$ 101.56。
Taken together, these three snapshots show structural changes in the Xyz:CL market on the Hyperliquid platformMARKETS TRANSITIONED FROM EMERGING MARKETS CONSTRAINED BY DB PRICE DISCOVERY (ON WEEKENDS 1 AND 2) TO INCREASINGLY LIBERAL PRICE DISCOVERY, WITH OVER- AND BACK-TO-BACKS (ON WEEKENDS 3)。
Analysis of price deviations (3 hours, 1 hour, 0 hours) between different weekends before CME starts shows that W3 data are the most reliable because the xyz:CL market was affected by DB during the previous two weekends. In W3, xyz:CL, the error of three hours and one hour before CME is opened is about +70 and -139 basis points, respectively, indicating that their price discovery capacity is better than the previous weekend。
Other indicators
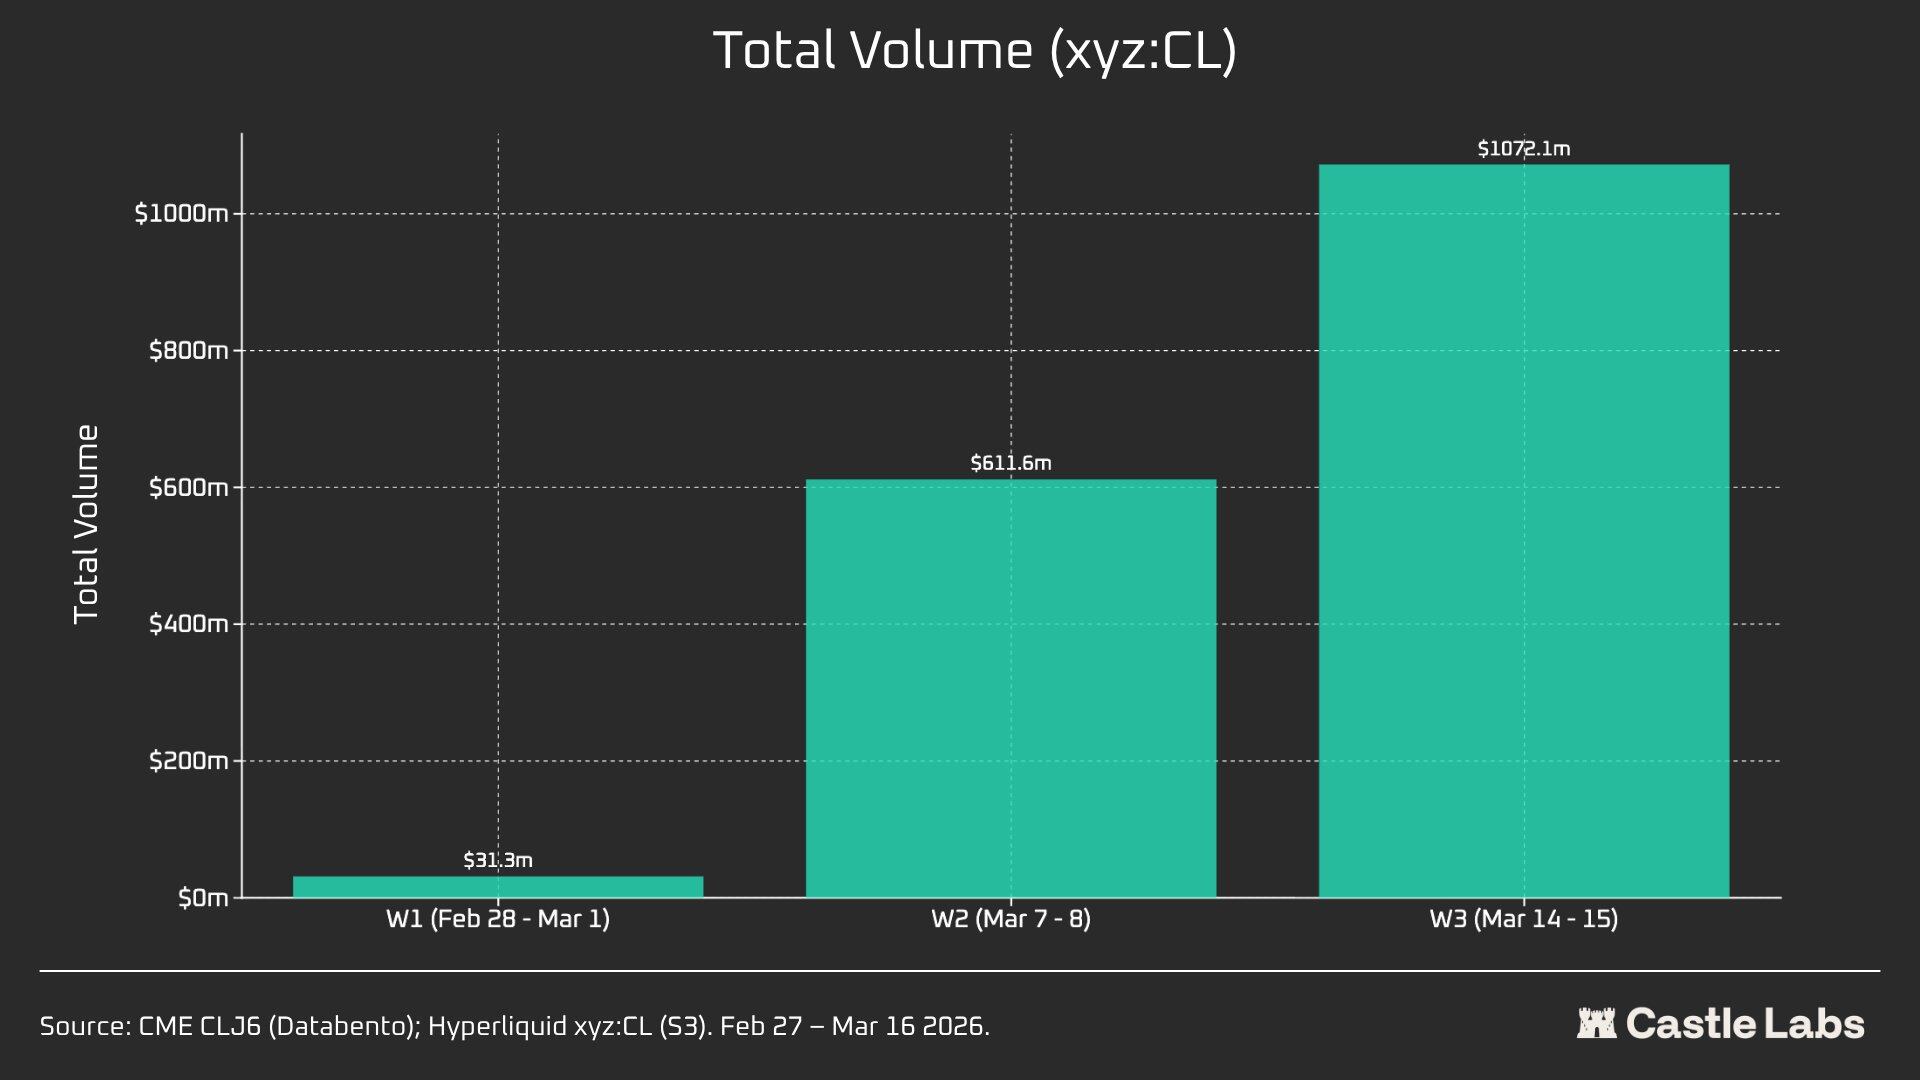
We also provided other indicators for the weekend summary analysis, including the volume of transactions, the total number of transactions and the average size of transactions. These indicators have changed between weekends and have continued to grow over successive weekends。
xyz: The total volume of transactions in the CL market increased in three weeks from $31 million to over $1 billion, reflecting the increase in the number of users and the eventual maturity of the market。
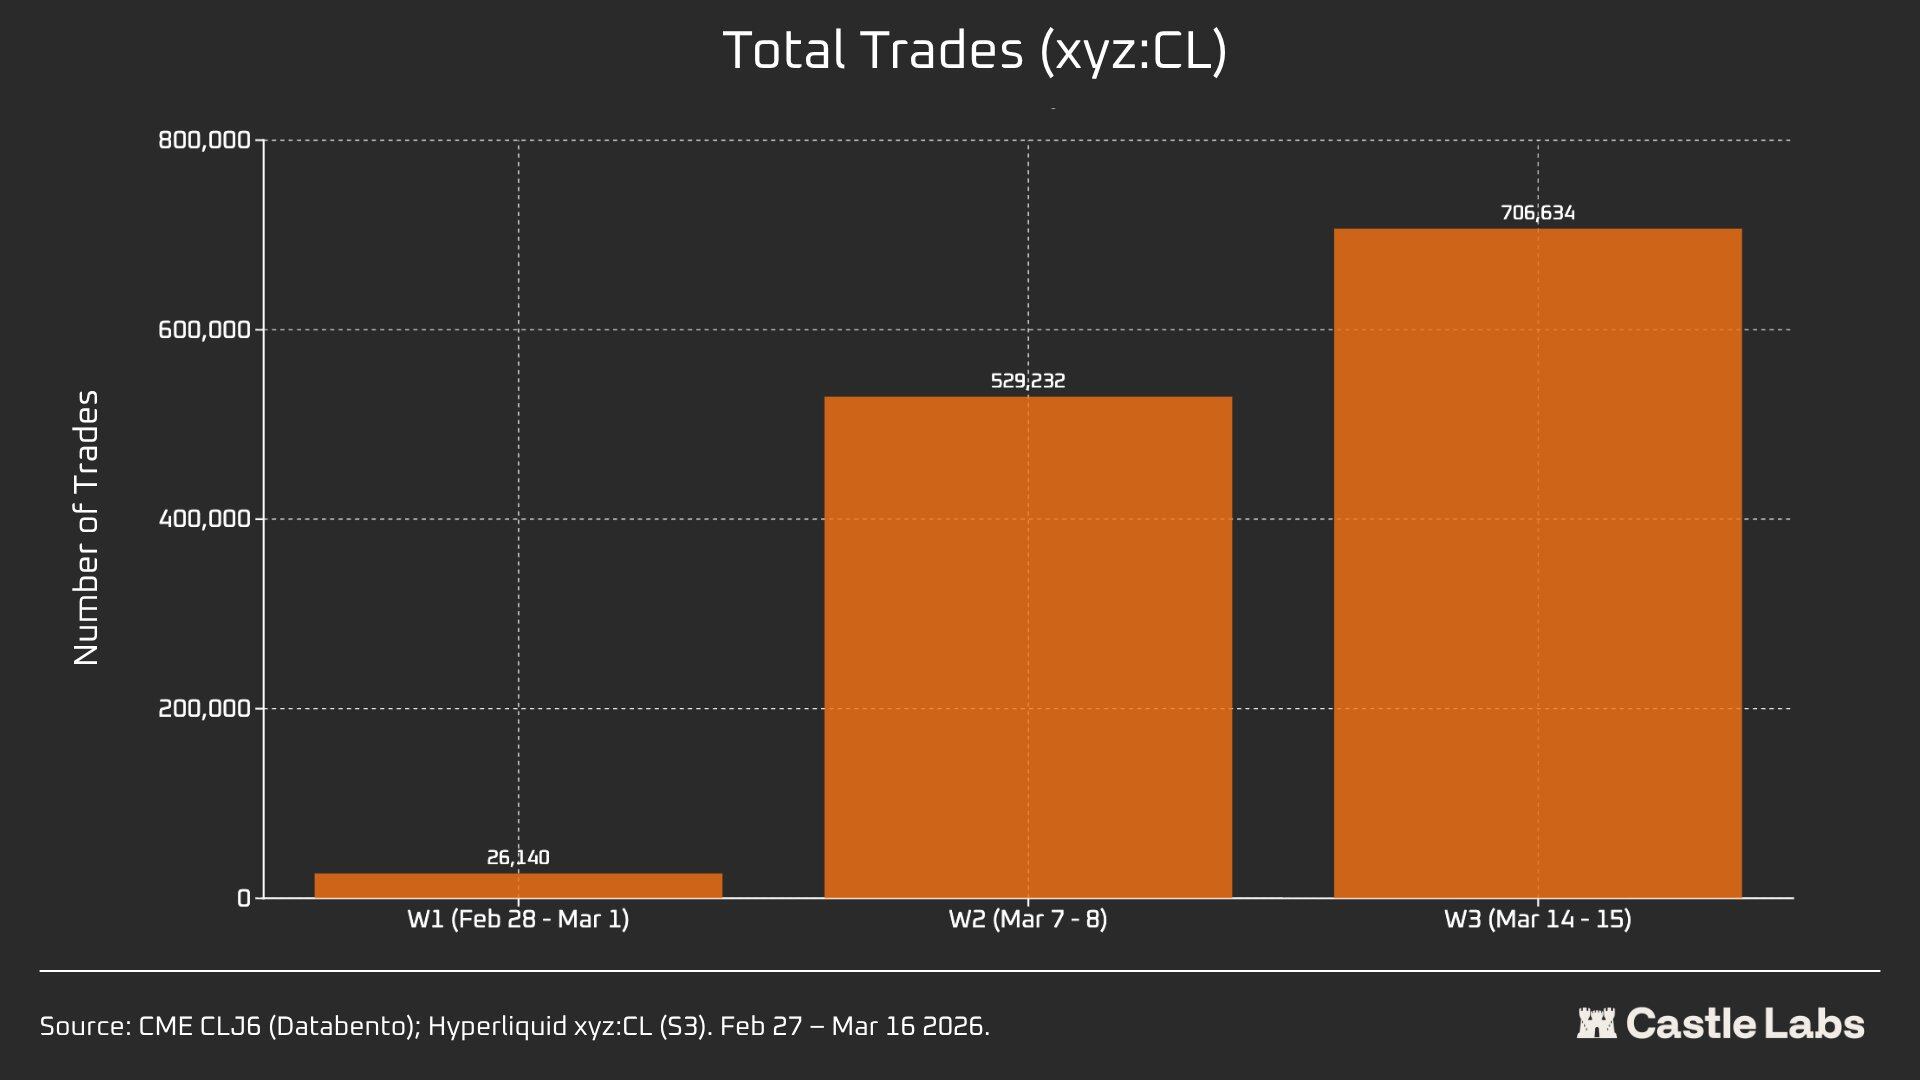
In addition, the total number of transactions increased from 26,000 at the first weekend to over 700,000 at the third weekend。
It is worth noting that the average volume of transactions over the weekend actually increased from the median we mentioned earlier to $534. The same growth trend was observed over all three weekends, which may indicate more institutional capital flows to the market。
The average size of the first weekend was $1199, and by the third weekend it had grown to over $1,500。
This may indicate differences in the group of users using the platform on weekends, a decrease in the number of bulk users and the need for more traders to gain access to crude oil trading by MondayAs a result, weekend transactions are closer to hedging demand rather than speculation。
