Author: SoSoValue Community Researcher ET (Agarwood Capital)
I. Preamble
When investors are still looking for emotional and technical explanations for the decline in bitcoin, the real answer is entered in the books of the United States financial system: The dollar liquidity is experiencing a structural contraction。In the form of
- THE TGA ACCOUNT BALANCE OF THE MINISTRY OF FINANCE IS CLOSE TO $1 TRILLION AND ABSORBS SIGNIFICANT MARKET LIQUIDITY
- Short-end financial market pressure surged, SOFR– FDTR spreads were expanded to +30bp
- The Fed was forced to restart its interim buy-back operation, which injected nearly $30 billion in liquidity & mdash; for the first time since the repurchase crisis in 2019。
this mobility & ldquo; vacuum & rdquo; not by chance, the core is the closure of the government。The Ministry of Finance is in advance of &ldquo at the risk of budget impasses and the closure of potential governments; &rdquao; large amounts of debt are locked into TGA accounts and cash is withdrawn directly from the reserve of the banking system, at its disposal “ market dollars ” are being reduced and risk assets are naturally under pressure — — bitcoin is the first and most sensitive victim。
However, the script is not entirely pessimistic. Historical experience has shown that each time the Ministry of Finance replenishes its stocks and its liquidity is extremely tight, it also tends to portend a reversal。
As of November 5, the United States Government had updated its historical peaks in closing days, and pressure on the fiscal, economic and human levels was rapidly accumulatingI don't knowTHE SNAP FOOD SUBSIDY IS LIMITED, SOME AIRPORT SECURITY CHECKS AND FEDERAL AIR TRAFFIC CONTROL SERVICES HAVE BEEN TEMPORARILY SUSPENDED, AND THE CONFIDENCE OF THE POPULATION AND BUSINESS HAS SHRUNK. IN THIS CONTEXTSigns of easing the confrontation between the two parties, in particular the recent high-profile return of the United States stock, will also help to speed up the Government's closure。
The market anticipated that the Senate might push for a compromise to end the Government ' s suspension before the end of Thanksgiving Day on 15 November。BY THAT TIME, THE MINISTRY OF FINANCE WILL RESTART SPENDING, AND THE TGA BALANCE IS EXPECTED TO FALL FROM THE TOP, WITH A RETURN TO LIQUIDITY AND A RETURN TO RISKbitcoin or right in this round of adjustment “ last drop ” phase— — the new liquidity cycle will also be restarted at the intersection between the recovery of fiscal spending and future interest-rate cycles。
II. BTC IS FACING A DOLLAR LIQUIDITY SHOCK
AS A VIABLE ASSET, THE BTC IS VERY SENSITIVE TO LIQUIDITY, AND UNITED STATES DOLLAR LIQUIDITY STRAINS ARE OFTEN A DOWNWARD PRESSURE ON THE BTC, WHICH IS ONE OF THE REASONS FOR THE APPARENT VULNERABILITY OF THE BTC SINCE MID-OCTOBER, ESPECIALLY IN THE CONTEXT OF THE NEW HISTORY OF NANO-FINGER。
As at 31 October, as shown in figure I:
- SOFR– FDTR spreads up to +30bp & rr; real inter-bank capital prices above policy interest rate ceiling, representing bank borrowing at higher cost and tight liquidity
- (a) RRP balances rebounded to $50.3 billion & rrrr
Figure I: SOFR– FDTR spreads and RRP balances
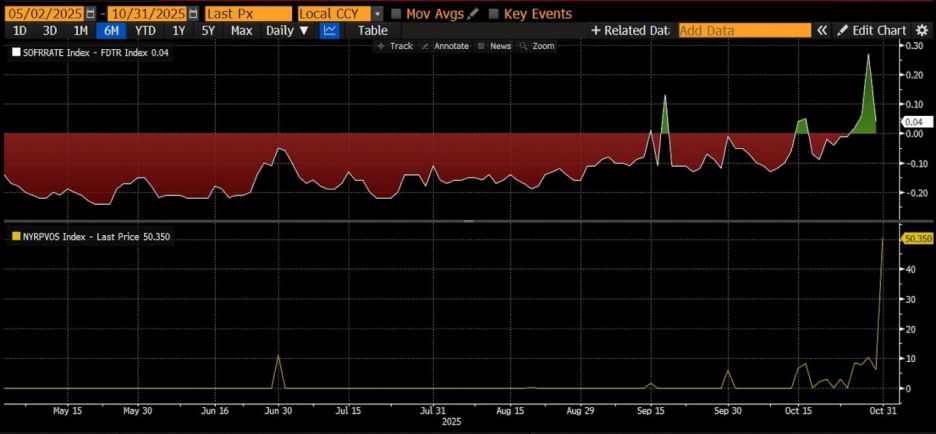
This indicates a clear sign of tension in the short-end capital markets in the United States, where the Fed was forced to restart temporary buy-back operations, injecting nearly $30 billion in liquidity on 31 October。
This was the first such operation since the buy-back crisis in 2019, marking a shift in liquidity shortage from a phased phenomenon to a structural problem。
ON THE WHOLE, THE MACRO-CURRENCY SUPPLY (M2) REMAINS RELAXED, BUT THE SECURITY CUSHIONS FOR THE BANKING SYSTEM RESERVE ARE BEING QUICKLY DRAINED, WHILE THE UPTURN IN MARKET LENDING RATES SHOWS THAT LIQUIDITY PRESSURES ARE NO LONGER EXPECTED, BUT RATHER ARE OCCURRING。
A FOLLOW-UP OBSERVATION OF LIQUIDITY IS THEREFORE AN IMPORTANT REFERENCE IN DETERMINING THE DIRECTION OF BTC PRICES。
FIGURE II: BTC PRICES AND FED LIQUIDITY
III. U.S. dollar liquidity dismantling
United States dollar liquidity = bank reserve + cash in cash = total Fed balance sheet size − ON RRP (overnight reverse purchase) & Minus; Treasury TGA account
This is the central framework for observing "the disposable dollar balance in the US financial system". It reveals:
The US dollar's total liquidity = the Fed's "supply side" - the "absorption end" of the Treasury and the currency market。
The composition is as follows:
| Component | Annotations | Impact on liquidity |
| Bank reserves (Reserves) | The balance of commercial bank deposits in the Federal Reserve is the most direct liquidity in the system。 | when adding & rar; liquidity easing |
| Circulation in cash | Cash held in the hands of enterprises and individuals。 | General growth steady, small change in the short term |
| ON RRP (Overnight Reverse Repo) | A short-term tool for the IMF to “loan” funds to the Fed is equivalent to “sniff” liquidity。 | when increasing & rar; liquidity tightening |
| TGA (Treasury General Account) | THE TREASURY IS IN THE PRINCIPAL ACCOUNT OF THE FEDERAL RESERVE FOR GOVERNMENT REVENUE AND EXPENDITURE. WHEN TGA RISES, IT MEANS THAT THE TREASURY "SUCKS" MARKET LIQUIDITY。 | when increasing & rar; liquidity tightening |
1. Logical relations
This formula actually describes the financial flow path between the Fed, the Treasury and the money market:
(b) Increase in reserves and cash & rrr。
TGA raises & rrr; Treasury issues debt collection & rrr; Liquidity decreases when the government increases its debt, taxes flow to TGA, and market funds are "sucked away."。
OON RRP Rising & Rarr; Money Market Fund deposits idle money into Fed & Rarr; Liquidity decrease is equivalent to IMF `stopping' market funds in Fed and no longer circulates in the banking system。
Therefore:
Liquidity & uarr; = Fed & uarr; + TGA & darr; + RRP & darr;
2. Practical application
This indicator is key to observing the liquidity cycle of risk assets:
When TGA + RRP simultaneously declines & rrr; Bank reserve surges & rrr; United States dollar liquidity easing & rrr; usually associated with an increase in risk assets (stock market, bitcoin)。
When TGA fixes, RRP up & rrrr; Liquidity Recovery & rrrr; Risk asset underwriting。
Specific examples:
Second half of 2023: TGA replenishment stock & rrrr after the cancellation of the debt ceiling; Short-term tightening of liquidity & rrr; fluctuations between US equity and encrypted assets。
At the beginning of 2024: RRP is falling rapidly, and capital flow banks & rrr; Reserve rebound & rrr; Market risk preference increases。
3. Extended observations: linkages to markets
| Indicators | Relevance | Annotations |
| S& P500/ NASDAQ | Positive | Liquidity has contributed to valuation expansion |
| BITCOINBTC | Heightly relevant | Risk increases when liquidity is loose |
| UNITED STATES DOLLAR INDEX DXY | Negative | Increase in the United States dollar supply and weakness of the index when liquidity is relaxed |
| Rate of return on United States debt | Depending on the stage | QE PHASE LOW RETURN; QT PHASE HIGHER RETURN |
Conclusions
This formula is in fact the liquidity equation for the entire dollar system。
The Fed has decided on "total supply"。
TGA AND ON RRP ARE TWO "LIQUID VALVES" THAT DETERMINE HOW MUCH MONEY GOES INTO THE FINANCIAL MARKET。
IT IS THEREFORE MORE IMPORTANT THAN LOOKING AT THE FED’S BALANCE SHEET ALONE IN ANALYSING THE MOVEMENT OF RISK ASSETS TO OBSERVE CHANGES IN RRP + TGA, WHICH ARE THE REAL DRIVERS OF SHORT-TERM DOLLAR LIQUIDITY。
iv. Recent causes of liquidity stress — — TGA Sustained Gold
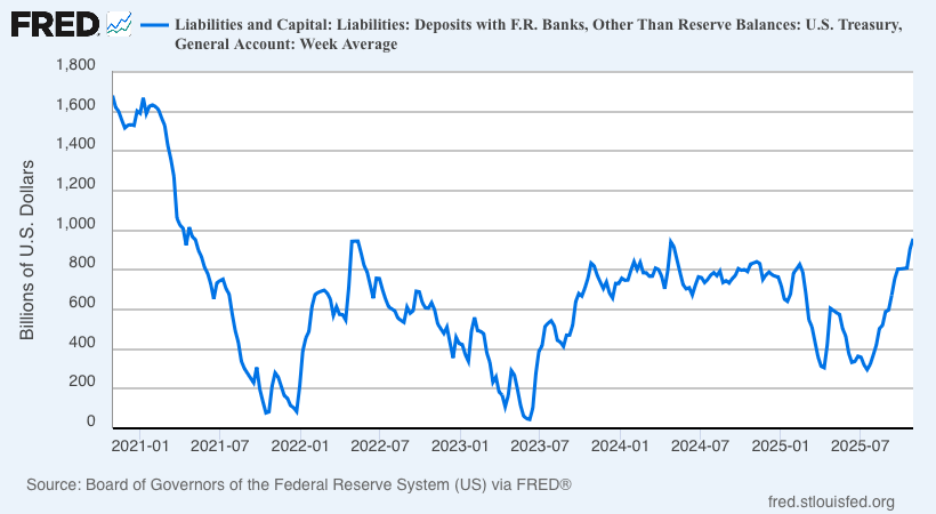
FIGURE III: CHANGES IN UNITED STATES TREASURY TGA ACCOUNT BALANCE
1. Interpretation of indicators
The figure above shows the United States Treasury's TGA (Treasury General Account) balance in the Fed's main account. The horizontal axis is time (2021– 2025) and the vertical axis is in value (billions of United States dollars). This line, which in fact reflects the absorption or release of liquidity by the Ministry of Finance, is an important regulating valve for dollar liquidity. The following is a complete professional interpretation of the recent government shutdown risks and financial operations。
THIS LINE FLUCTUATES, REPRESENTING THE MINISTRY OF FINANCE, "TGA UP" OR "TGA DOWN."。
TGA Increase & rrr; Government absorbs market liquidity (reduced bank reserve)
TGA Decline & rar; Government release market liquidity (increase in bank reserves)
Therefore:
TGA & asymp; reverse indicator of market dollar liquidity
WHEN TGA RISES, MARKET FINANCE BECOMES TIGHT; WHEN TGA FALLS, MARKET FINANCE BECOMES LOOSE。
combining time and event: 2021– 2025 five-year mobility rhythm
| Time period | TGA CHANGE CHARACTERISTICS | Background events and mobility effects |
| 2021 Q1 & ndash; Q3 | continuous decline (from 1.6 trillions & rrr; 0.2 trillions) | THE BIDEN GOVERNMENT PUSHED FOR MASSIVE FISCAL STIMULUS, HIGH SPENDING BY THE MINISTRY OF FINANCE AND CONSUMPTION OF TGA; THE DOLLAR WAS EXTREMELY LOOSE, DRIVING THE RISE IN STOCK MARKETS AND ENCRYPTED ASSETS。 |
| 2022 First half | TGA QUICKLY RISES TO ~800 B | The Ministry of Finance replenished the stock in response to the cap risk; in the meantime, Fed launched the QT, tightening liquidity and weakening the United States equity and encryption markets。 |
| 2023 First half | TGA CRASH TO ~100 B | The United States debt ceiling crisis, the Department of the Treasury ' s moratorium on the issuance of debt and the use of cash to cover expenditures; short-term substantial release of liquidity (an increase in bank reserves), Bitcoin from 16K&rr; 30K。 |
| 2023 After Summer | TGA Large Replenishment (from 100 B & Rar; 700 B +) | THE DEBT-LIMITATION AGREEMENT WAS FOLLOWED BY A MASSIVE DEBT RELIEF TO REBUILD TGA AND ABSORB LIQUIDITY; DURING THE SAME PERIOD, THE US EQUITY SHOCK AND THE DEBT MARKET RATE OF RETURN ROSE。 |
| 2024 All year | Medium fluctuations at 400 & ndash; 800 B | The budget negotiations have been lengthy and partial closure threats; the Ministry of Finance has taken "dynamic stockpile management", with fluctuations affecting short-end interest rates and liquidity。 |
| Since the beginning of 2025 | Rapidly rising (close to 1 trillion) | THE GOVERNMENT IS MAKING PRECAUTIONARY RESERVES FOR NEW FISCAL YEAR EXPENDITURE AND POTENTIAL FOR DISENGAGEMENT; TGA REPLENISHMENT HAS RE-INTRODUCED LIQUIDITY。 |
II. STRUCTURAL CONTACT WITH THE “GUSTERS OF THE GOVERNMENT”
BEFORE CLOSING: MINISTRY OF FINANCE UPGRADES TGA FOR EMERGENCY PREPAREDNESS
WHEN THE BUDGET OF CONGRESS IS AT A STANDSTILL AND THE RISK OF CLOSURE INCREASES, THE MINISTRY OF FINANCE WILL RAISE THE TGA BALANCE BY EARLY DEBT FINANCING TO ENSURE THAT THE NECESSARY EXPENDITURES REMAIN IN CASH DURING THE GOVERNMENT ' S STANDSTILL。
At this stage, there will be short-term liquidity tightening and short-term interest rates rising。
Closure period: suspension of expenditure, restricted issuance of debt
GOVERNMENT PARTIAL PAYMENTS WERE SUSPENDED DURING THE CLOSURE, AND TGA LEVELS WERE FLAT OR SUBDUED IN THE SHORT TERM, BUT IMF DEMAND SURGED TO ON RRP AS THERE WAS NO NEW NATIONAL DEBT SUPPLY IN THE MARKET。
It's a "mobility structural mismatch": totals are neutral but short-term stress。
After closing the door: refinancing, payback & rrrr; TGA sharp drop
When government spending resumed, TGA fell and liquidity was released in an instant. The rise in bank reserves and the easing of pressure in the Repo market have often rebounded at this stage。
FOR EXAMPLE, BTC EXPERIENCED A SHORT-TERM SURGE AND A REBOUND AFTER THE 2023 DEBT RELIEF。
The Fed in Action: Liquidity Injection
Figure IV. United States Federal Reserve ON RPs
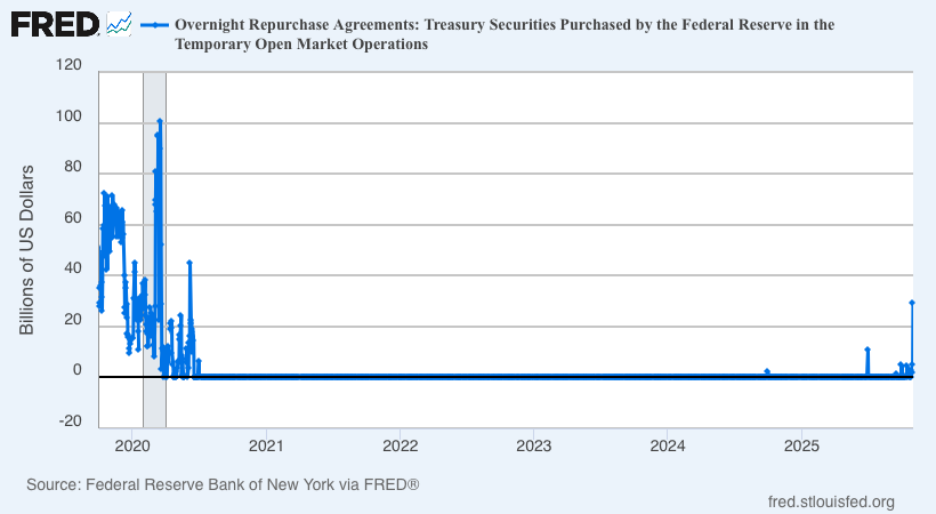
1. Interpretation of indicators
SOURCE: FRED (NEW YORK FEDERAL RESERVE)
Latest data (31 October 2025): $29.4 billion
Comparative reference: September 2019 height was $49.75 billion
This indicator represents a direct liquidity injection by providing overnight cash to major traders through temporary buy-back operations (backed by United States debt)。
The tool has been suspended for a long time since the outbreak, and this time it has been relaunched with significant policy signals。
2. Three main observations focus
The Federal Reserve responded to the "real shortage" of short-term finance markets. While QT was about to cease, the continued decline in reserves had led to increased pressure on borrowing. The re-launching representative of ON RPs: "The Fed is a passive abbreviation & rar; Active liquidity management. I don't know
Size characteristics: While below the 2019 crisis level, $29.4 billion is highly symbolic, indicating that the liquidity gap has exceeded the Federal Reserve ' s observation threshold. If the scale of operations continues to rise in the next two weeks, it can be considered a "quasi-policy shift"。
Market mechanisms:
Banks and money market funds were forced to raise financing interest rates because of shortfalls in reserves
The Federal Reserve released liquidity through buybacks, temporarily lowering SOFR and Repo
If the act continues, it becomesMICROQE EFFECTI don't know。
historical comparison: 2019 vs 2025
| Indicators | Repurchase crisis 2019 | October 2025 incident |
| Trigger factor | NATIONAL DEBT SETTLEMENT + RRP DEPLETED | NATIONAL DEBT SETTLEMENT + QT LED TO DEPLETION OF RESERVES |
| SOFR– FDTR spread | +30bp | +30bp |
| Repurchase size of the Fed | $49.7 billion | $29.4 billion |
| Policy responses | Term Repo+QE restart | ON Repo+ Watching |
| Result | RESERVE RECONSTRUCTION + QE4 OPEN | Still to be observed or progressively replenished |
Conclusions
1. THE CURRENT TGA ACCOUNT, WHICH IS CLOSE TO $1 TRILLION, IS THE MAIN CAUSE OF RECENT LIQUIDITY CONSTRAINTS, THE SUBSEQUENT REOPENING OF THE GOVERNMENT, THE RESUMPTION OF EXPENDITURES, THE EXPECTED DECLINE IN TGA, THE RECOVERY OF UNITED STATES DOLLAR LIQUIDITY AND THE PROSPECT OF SUPPORTING RISK ASSETS SUCH AS THE BTC
2. Until the Government restarts, the Federal Reserve continues to release liquidity through buy-backs, temporarily reducing the SOFR-Repo spread and reducing market liquidity tensions
3: The real money and silver on the site is projected to be in mid-November. On 15 November, institutions such as Goldman Sachs are expected to open the door within two weeks
THUS, THE BTC IS LIKELY TO BE CARRYING OUT A `LAST FALL', AND AT LEAST THE OPENING OF GOVERNMENT DOORS AND FUTURE INTEREST RATES ARE CERTAIN, ALTHOUGH THE RHYTHM IS UNCERTAIN。