
We're getting out of Bear City
The phase of panic may have passed, but it is too early to announce the opening of a new cattle market。

Original by Claude, Deepwater TechFlow
deep tide guide: CriptoQuant ' s Bull-Bear Market Cycle Indicator has been revised for the first time since October 2025, while another core indicator, Bull Score Index, rose to a neutral zone in late April 50. Bitcoin has been rising for three consecutive months, with prices rebounding from a low point of about $60,000 million in February to over $81,000. However, the previous car in 2022 reminded the market that similar signals had failed a week later, and prices continued to fall。
Data on the Bitcoin chain is releasing a long-defended positive signal。
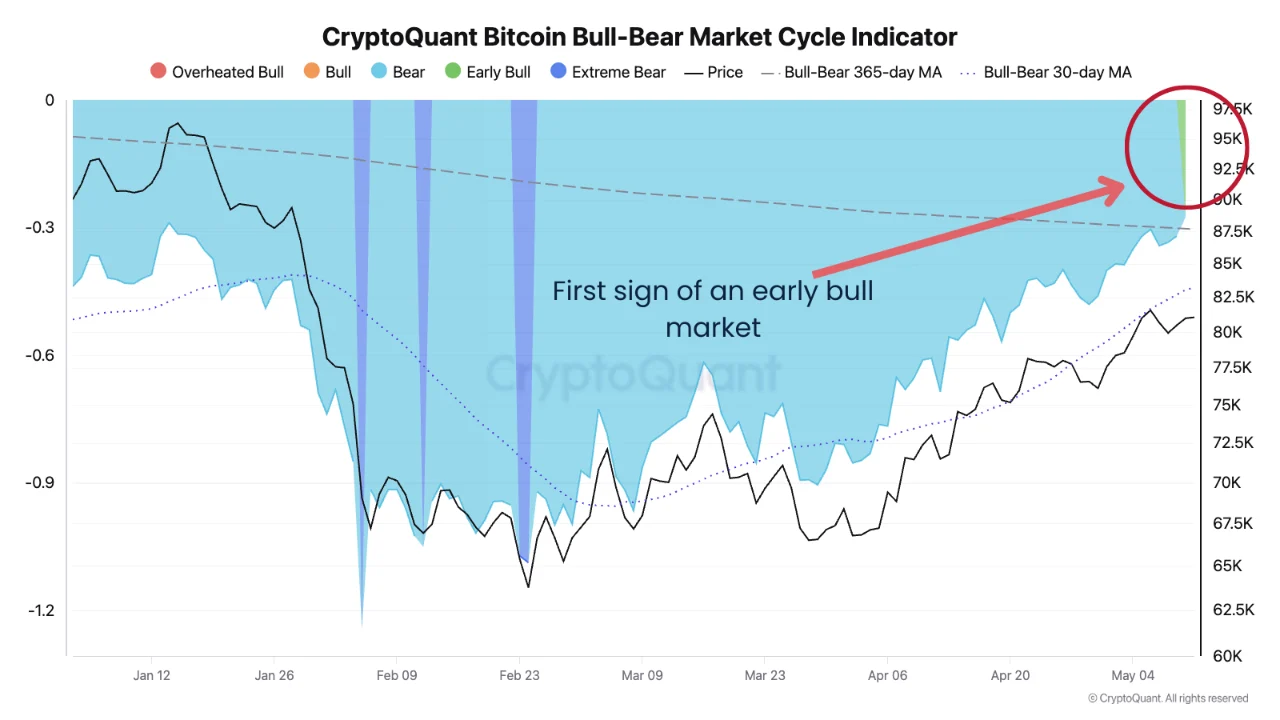
According to the CriptoQuant platform, the Bull-Bear Market Cycle Indicator (Bull-Bear Market Cycle Indicator) has recently re-entered the positive zoneThis is the first time since the P& in October 2025; the L index fell 365 days。
By measuring the distance between the P& the L index and its 365-day moving average, the indicator determines whether Bitcoin is currently in cattle or bear market cycles. The P& L index itself combines the three core chain indicators of MVRV ratios, NUPL and short- and long-term holders SOPR, which are a harmonized valuation tool used by Crystal Quant to assess whether Bitcoin prices are overvalued or undervalued。
As at the time of the submission, the price quoted in bitcoin was approximately $81,000, which was 35 per cent higher than the cycle of approximately $60,000 at the beginning of February。
Source: CriptoQuant, original poster analyst & nbsp;MorenoDV
It took seven months to repair the chain from the deep bear to the first time
Reviewing the chain trajectory of the bear market: In October 2025, after a sharp fall of bitcoin from a historical high of $126,000, the bull and bear cycle indicator fell rapidly into negative range. Cryptonomist reported in February this year that this indicator fell to about -1.2 in early February, similar to the low point in March 2020 when the new crown crashed. CryptBull also confirmed that indicator readings have reached the lowest level since the bottom of the FTX crash in 2022。
The restoration lasted about three months, from the bottom of the deep bear in February to the latest days. This rate is faster than that of the 2022 cycle (the target for that year remained between negative values for about 12 months), but the sustainability of the repairs remains controversial, considering that the current cycle has fallen by about 55 per cent from peak to valley (from $126,000 to less than $60,000)。
Bull Score Index sync to neutral, multiple indicator resonance
The reversal of the cyclical indicator is not an isolated event。
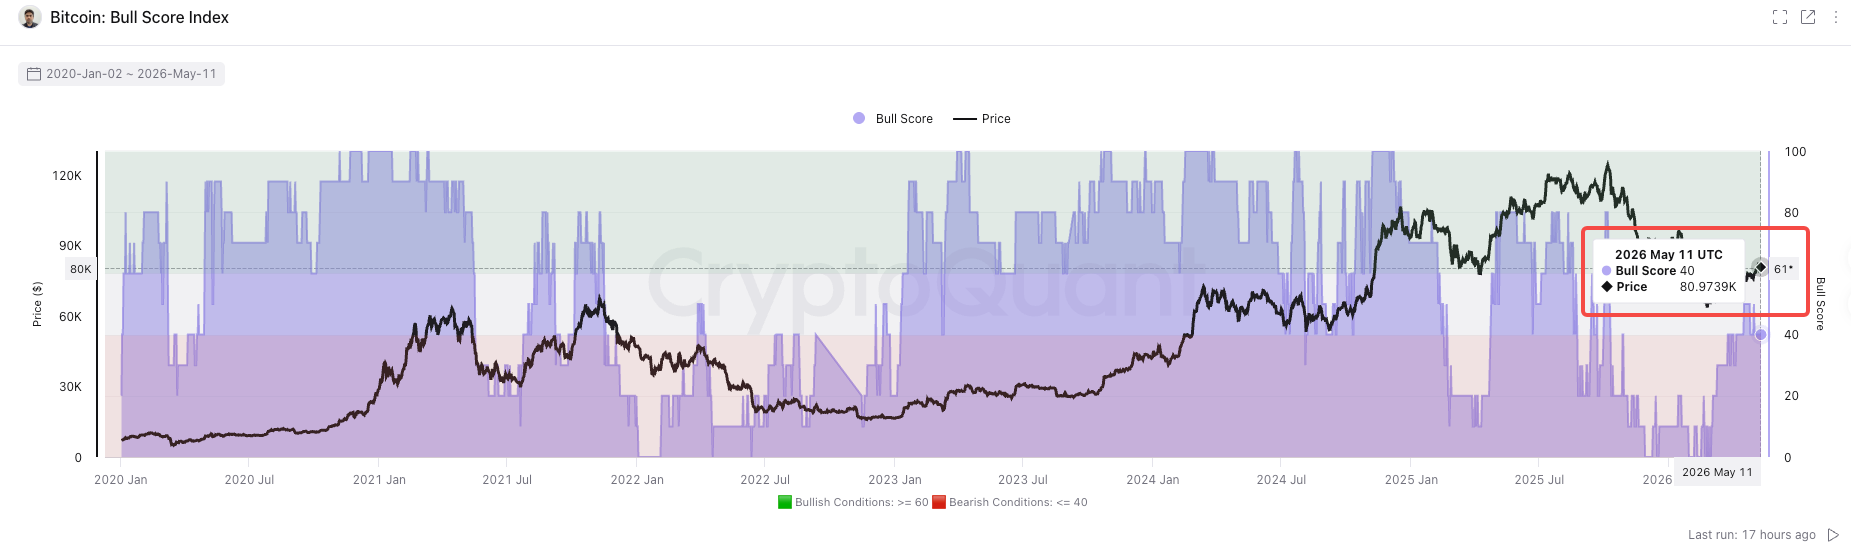
On 23 April, CoinDesk reported that another core indicator, CriptoQuant, Bull Score Index, had risen to a median reading of 50 during the same period, the first time that the index had fallen since Bitcoin began to fall from a high point of $126,000。
Bull Score Index combines 10 chain indicators covering dimensions such as block chain activities, investor profitability and liquidity。Readings below 40 usually mean structural bear markets, and above 60 points to a strong and sustainable upward trend。
In response, Julio Moreno, Director of CriptoQuant Research, stated that this was the first time that Bull Score Index had entered a neutral zone in the city of Bears. He referred, however, to the previous example in March 2022, when the index had also risen briefly to 50, but only for about a week, after which prices continued to fall sharply。
Improvements in the price dimension are equally evident. Bitcoin grew by about 2 per cent and 12 per cent in March and April, respectively, and has so far increased by about 6 per cent in May, with positive returns recorded for three months in a row。
2022 "Fake Signals": History does not have to repeat, but the market remembers
The market's greatest misgivings about the current positive signals came from the history of 2022。
In March of that year, Bull Score Index had briefly risen to a neutral zone of 50, and later Bitcoin fell from approximately $47,000 to $16,000. The Cows and Bears cycle indicator also showed a brief correction in 2022, but eventually continued to fall deep after the impact of the Luna/UST and FTX series。
However, there are structural differences between the current cycle and 2022. The real bitcoin ETF has been an important institutional demand anchor since its listing in January 2024. According to SpotedCrypto, net inflows of real bitcoin ETF in April amounted to $2.44 billion, the strongest month since October 2025. Glassnode shows that the number of whale addresses with more than 1,000 bitcoin increased by 142 in the last six months. In addition, Glassnode ' s RHODL ratio, which is currently 4.5, is the third highest reading in the history of Bitcoin, with two similar highs at the end of the cycle in 2015 and 2022, respectively, followed by ongoing cattle markets。
StoneX Global Research Manager Matt Weller provides a more cautious frame of reference in the Q2 outlook。
Based on the four-year half-cycle of bitcoin, the persistent bottom of the current cycle is likely toIt's not until around the fourth quarter of 2026. If the historical pattern is established, the drop from the bottom of the peak is about 60 per cent and the corresponding price is about $50,000。
For traders, the real meaning of the current signal may be:
The phase of panic may have passed, but it is too early to announce the opening of a new cattle market. Bitcoin needs to break through the 200-day average of $82,000 above and stand steady in order for the technical side to give a more convincing reversal of the trend。
