
The agency's outflow and the spot throws continue, with $54,000 bitcoin at the bottom
The real price is 53,400 to the potential bottom, and can Coinbase buy back the heat?

Photo by Glassnode
Original: AididiaoJP, Foresight News
BITCOIN FELL BY $60,000, LOST MONEY, ETF OUTFLOWS AND DEFENSIVE SILOS CONTINUED TO SUPPRESS MARKET SENTIMENT. DESPITE EVIDENCE OF VALUE AND SELECTIVE ACCUMULATION, WIDESPREAD DEMAND HAS NOT EMERGED。
Summary
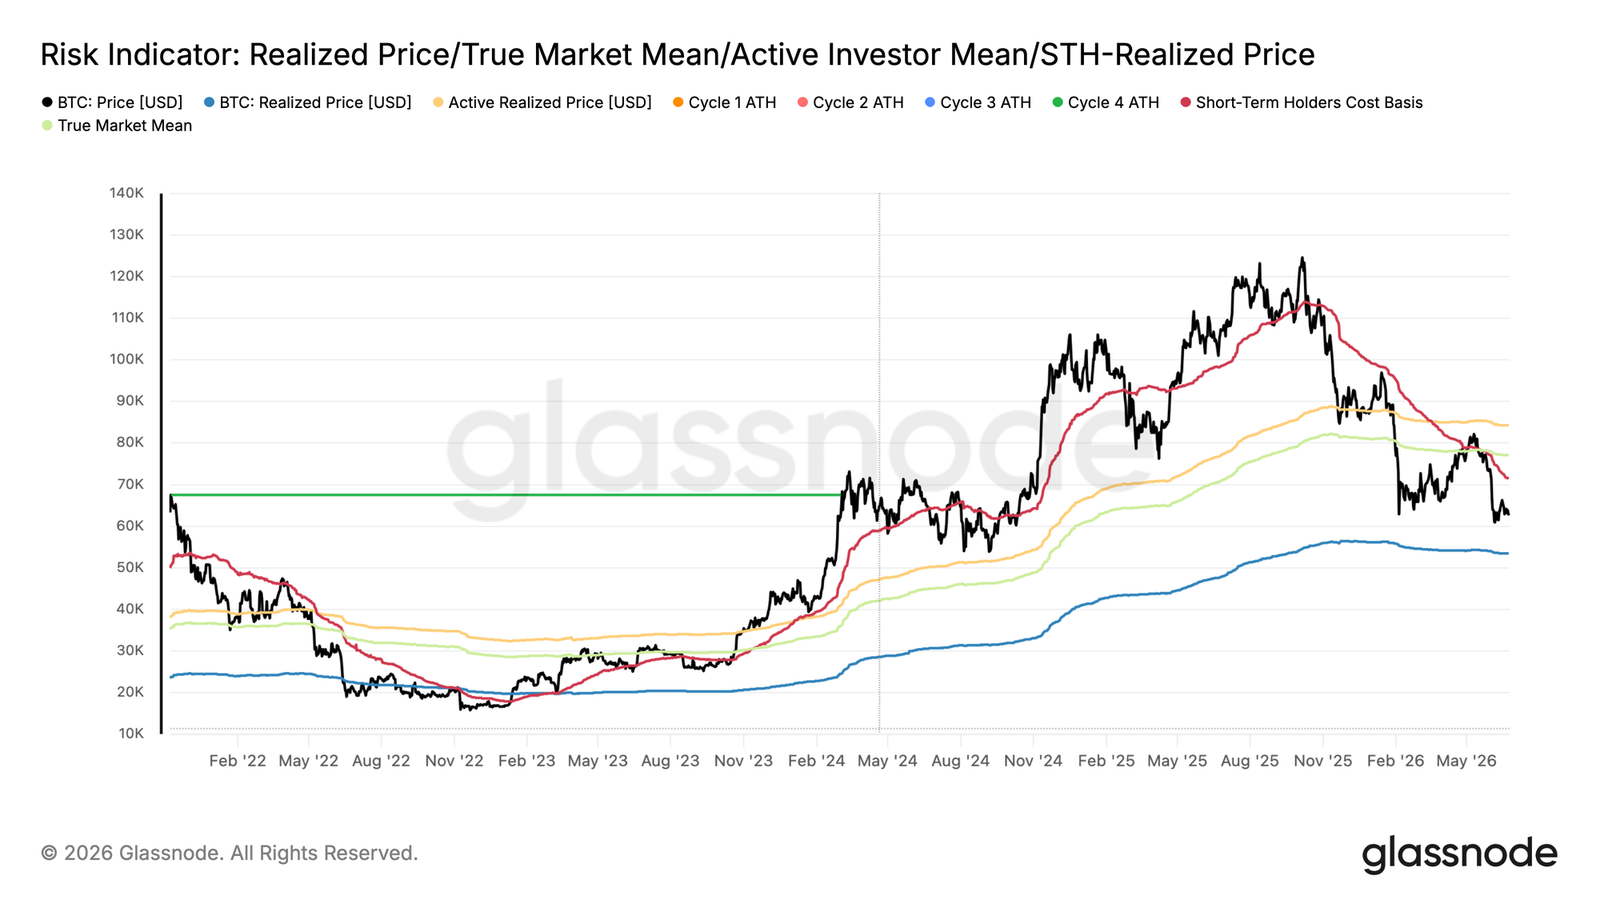
- Bitcoin is currently traded at $62,300, with a real market average of $77,000 and a 19 per cent discount. The short-term holder ' s cost base has fallen to $71,400, indicating that new buyers accumulate for the first time below average cyclical prices, a constructive early step towards bottom formation. (bitcoin had fallen to $60,800 by the time it was sent)
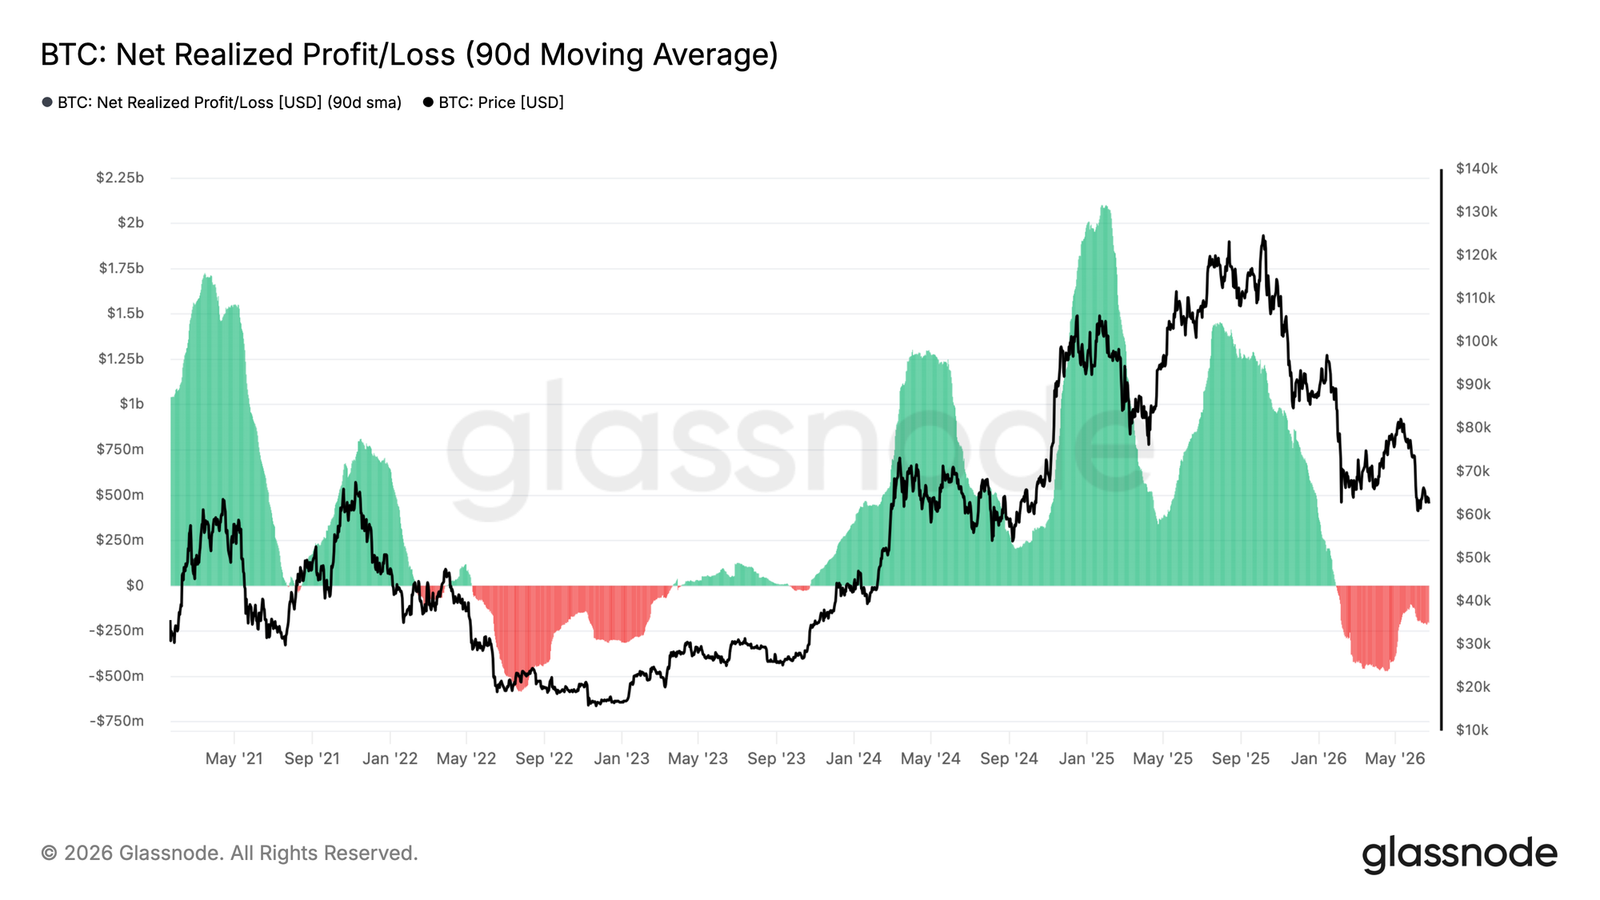
- The 90-day average of net realized gains and losses is in the order of -205 million United States dollars per day, confirming that the market depth is embedded in the prevailing loss environment and that the focus is tilted towards the realized price of $53,400, rather than the real market average。
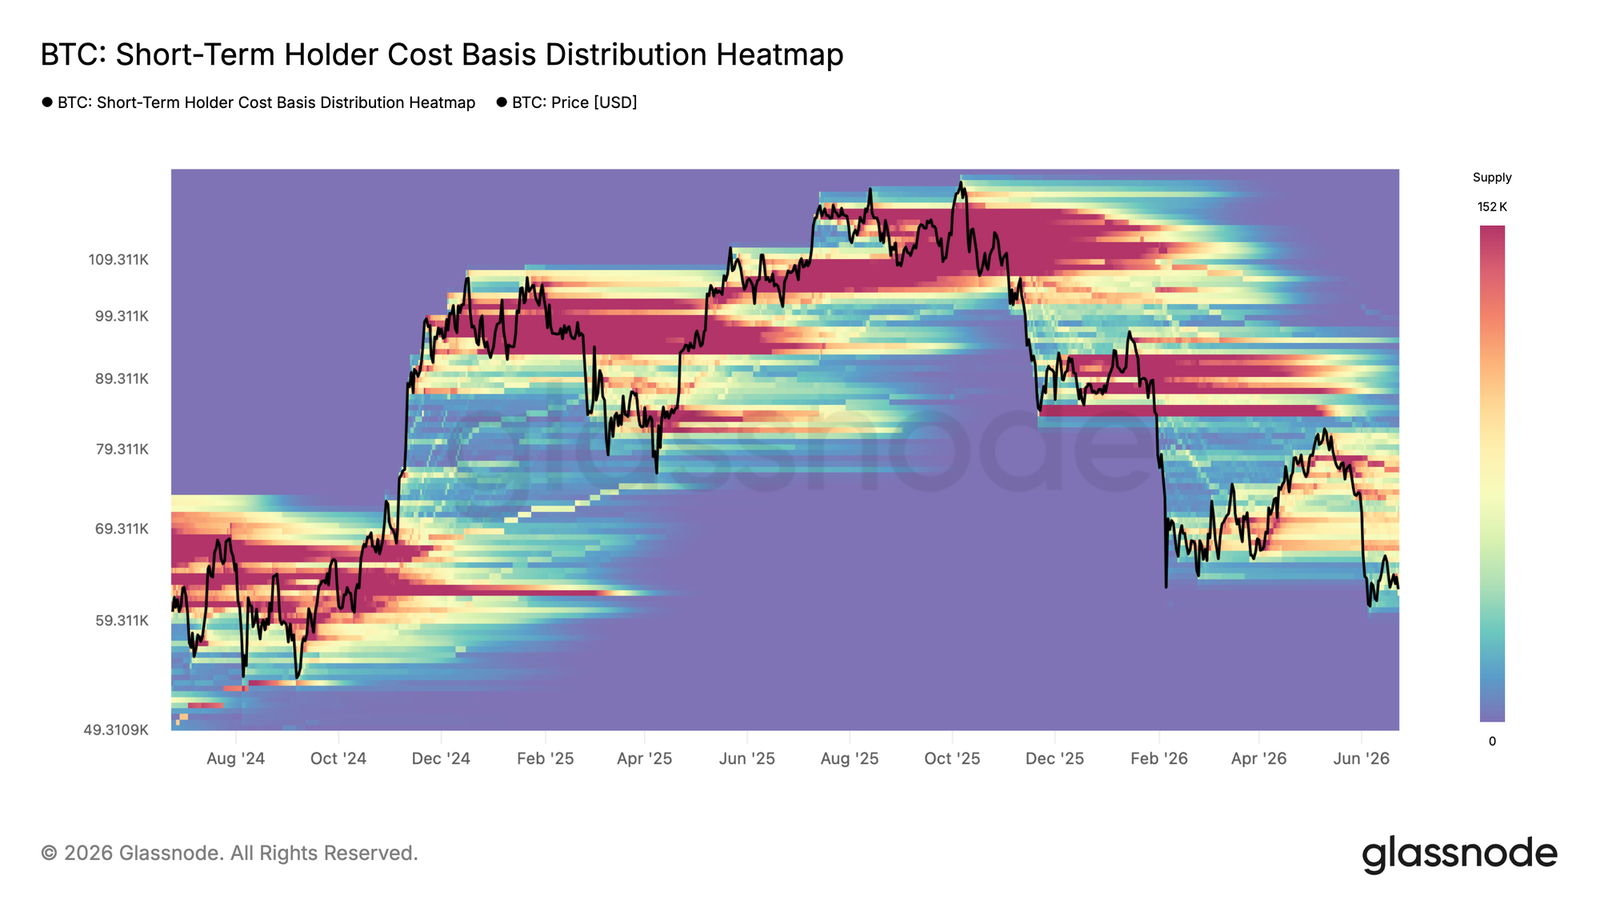
- The short-term holder-intensive supply cluster is located between US$ 66,800-70,700, creating the most direct upper resistance. Short-term upper space is limited until the region is recovered and the path to the short-term holder cost base is opened。
- ETF CONTINUES TO EJECT: INSTITUTIONAL DEMAND REMAINS WEAK, AND GTTC ACCOUNTS FOR THE LARGEST SHARE IN RECENT REDEMPTIONS。
- Coinbase buyer returns: American investors show a buyout while Binance traders maintain defensive postures。
- The spot market dominates sales: sales originate in the spot market and derivatives are mainly followed rather than driven。
- Implicit fluctuations have stabilized near recent lows, but the realized volatility remains high and the volatility risk premium has remained negative。
- Protection needs have been re-established at the lower end of each period, with significant increases in bias, despite relative restraint in overall volatility pricing。
- RECENT FINANCIAL FLOWS HAVE SHIFTED TO SELLING PREMIUMS, WHILE COMMERCIAL POSITIONS REMAIN DOMINATED BY 60K-64K DISTRICT LONG GAMMA, HELPING TO CONTROL VOLATILITY NEAR CURRENT SPOT PRICES。
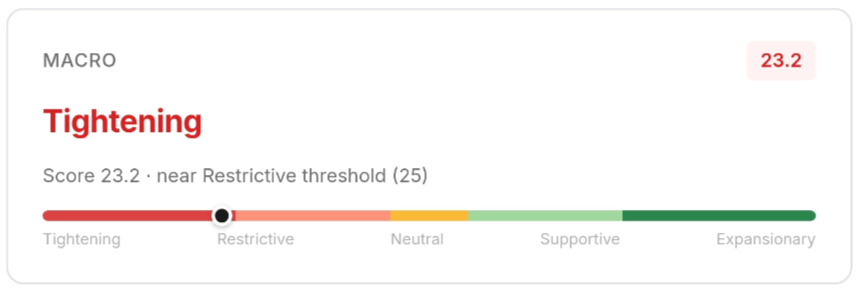
Macro Insight
THE DOLLAR INDEX RETURNS 200 DAYS ABOVE THE AVERAGE. ON 23 JUNE, THE DXY NEWSPAPER, 101.37, RECOVERED SIGNIFICANTLY FROM THE DATE BEFORE 99.24 AND STOOD ON THE 200-DAY MEAN LINE FOR THE FIRST TIME SINCE THE EMANCIPATION DAY IMPACT IN APRIL 98.72. SEE IF THE INCREASE SEQUENCE IS NOT KEPT。
THE ANNUAL US DEBT RETURN REMAINED AT 4.50 PER CENT, WITH NO SIGNS OF DECLINE. VIX ROSE FROM 16.2 IN THE MIDDLE WEEK TO CLOSING ON FRIDAY 19.49, WHICH IS NOT A LEVEL OF PANIC, BUT THE CHANGE IN DIRECTION IS OF CONCERN. THE STOCK MARKET HAS DIGESTED THE SPRING ROUND, REPORTING 7,365 POINTS ON THE 500 INDEX, AN INCREASE OF 14 PER CENT OVER THE APRIL LOW POINT, AND IS STANDING ABOVE ITS 200-DAY AVERAGE OF 7,007 POINTS。
BITCOIN WAS NOT INVOLVED IN THIS RECOVERY. BTC CURRENTLY REPORTS $62,651, WHICH IS 18 PER CENT BELOW ITS 200-DAY AVERAGE OF $76,466. MACRO-RECOVERY REMAINS A STOCK MARKET STORY SUPPORTED BY THE PROFITABILITY OF UNITED STATES ENTERPRISES. IN BITCOIN, DXY'S RE-EMERGENCE IS THE DOMINANT SIGNAL, NOT GOOD FOR BTC。
Insight on the chain
Depth discount area
The current price of bitcoin is $62,300, well below the real market average of $77,000. The real market average is the average cost basis for non-mineral active investors and the key threshold for distinguishing between bear and cattle markets. The current discount of 19 per cent indicates that prices are still trapped between structural bear cities。
It is noteworthy that the short-term holder cost base has fallen to $71,400, reflecting the large accumulation of new buyers below real market averages. From a cyclical perspective, this is a constructive development that marks a critical step towards the bottom — new capital is being deployed at prices that are increasingly delinked from recent cycles of overheating。
The supply bought during this bear-market phase is expected to show greater resilience in terms of losses relative to the wider cycle of suspension. If macro-driven downfalls occur in the coming weeks, the price has been achieved at $53,400, which would be a reasonable lower limit between the short to medium term bear towns。
Gravity pull down
After the establishment of the US$ 53,400-77,000 inter-city bear, the next question is where the price is more likely to converge. The net realized gain/loss indicator measures the net difference (in United States dollars) between profit and loss in the market, and effectively captures whether the dominant expenditure behaviour ends with profit or surrender。
The average daily value of this indicator, which is currently -205 million United States dollars per day, recognizes that the realization of losses has become the dominant force of broader trends, suggesting that the market centre of gravity remains tilted towards the current downwards (near the realized prices)。
As this is a slow-moving mean, the reading reflects the deep embedded loss-dominated environment rather than a single pressure event. If the indicator goes back to a neutral level (near zero), it will be a strong signal that the seller ' s depletion is taking place and that the transition conditions in the pre-cow city are beginning to emerge。
Short-term trends in supply restrictions above
In addition to the broader negative capital flow environment, the current concentration of supply from short-term holders above the spot further slows prices. The most significant cluster, located in the US$ 66,800-70,700 zone, represents the recent accumulation of tokens, which is in a state of loss and is likely to generate sales pressure in any rebound attempt。
The region has been effective in defining the most likely short-term cross-boarding or relief rebound ceiling, as the inter-zone holder tends to exit at a profit-and-loss balance point when the price is close to its purchase cost. A sustained recovery above $66,800 would significantly reduce the upward pressure and increase the probability of extending to a short-term holder cost base of $71,400 in the medium term. Until then, this localized supply remained an active anchorage for suppression。
Underlink Insight
ETF CONTINUOUS ESCAPE
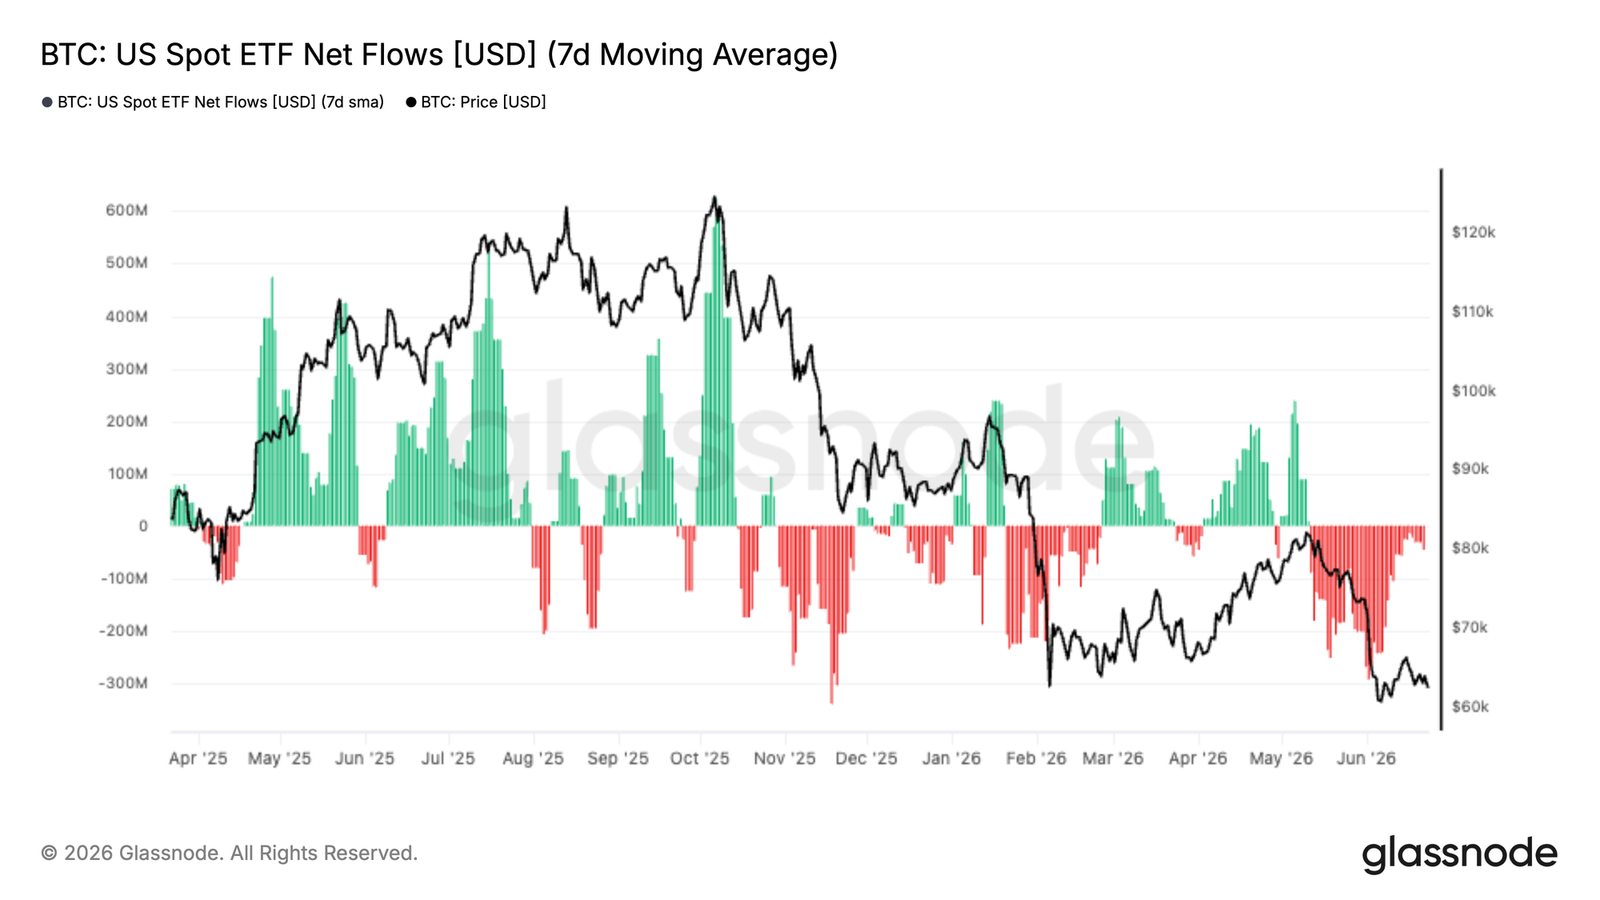
THIS WEEK'S INSTITUTIONAL DEMAND CONTINUES TO BE UNDER PRESSURE, WITH THE AVERAGE NET OUTWARD MOVEMENT OF US SPOT ETF 7 DAYS CLOSE TO $300 MILLION A DAY, ONE OF THE MOST SUSTAINED WITHDRAWAL PERIODS SINCE ETF WAS LAUNCHED. THE SIZE AND DURATION OF OUTFLOWS SUGGEST THAT TRADITIONAL INVESTORS MAINTAIN DEFENSIVE POSTURES DESPITE THE NEAR-TERM DOWNSIDE OF BITCOIN TRANSACTIONS (APPROXIMATELY US$ 60,000-65,000)。
IT IS NOTEWORTHY THAT BACKSLIDING TENDS TO ATTRACT ETF BUY-IN AND PROVIDE AN IMPORTANT SOURCE OF DEMAND FOR VULNERABLE PERIODS. THIS SUSTAINED BUYOUT SHOWS THAT MANY INVESTORS HAVE CHOSEN TO REDUCE THEIR EXPOSURE RATHER THAN ACCUMULATE IN A RETURN。
Although the ETF as a whole is negative, the ransom distribution is not even. Grayscale continues to hold the largest foreclosure share of over 16,000 BTCs in the past 90 days. This suggests that vulnerability is largely driven by the settlement and portfolio rebalancing of legacy holders, rather than a unified withdrawal of the entire ETF plate。
Cash buyers are returning
THE SPOT MARKET POSITION BEGAN TO IMPROVE AFTER A LONG PERIOD OF AGGRESSIVE SALES PRESSURE. WHILE THE OVERALL CVD DEVIATION REMAINS NEGATIVE, RECENT REBOUNDS SUGGEST THAT NET SALES INTENSITY IS DECREASING, HELPING BITCOIN TO STABILIZE BELOW THE TRADE ZONE。
The most notable development has been the fragmentation of exchanges. The Coinbase spot CVD deviations have risen significantly and are returning to positive values, indicating that the platform buys, which are usually associated with U.S. agency participants, are returning. And Binance is still in the negative range, implying that overseas traders continue to maintain defensive postures。
Such polarization points to increasingly unequal market structures. Institutional investors appear to absorb supplies in vulnerable situations, while speculators remain cautious. Although the wider spot market has not yet returned to a steady build-up, improvements in Coinbase demand suggest that some investors are beginning to see current prices as attractive entry levels。

Futures follow the spot back
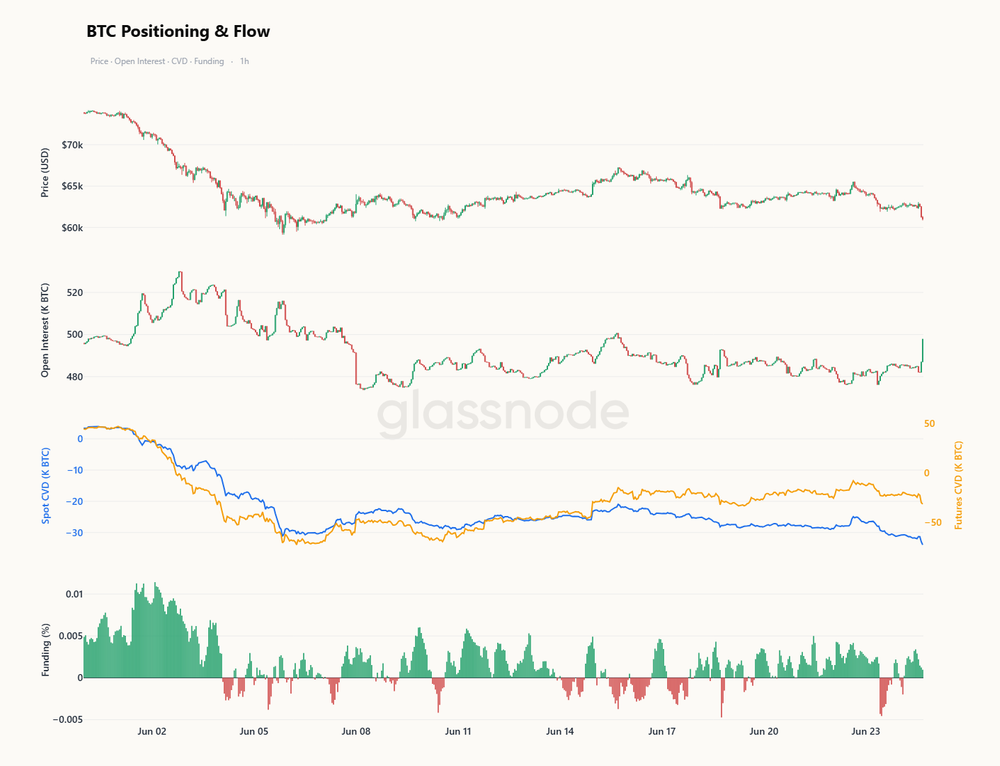
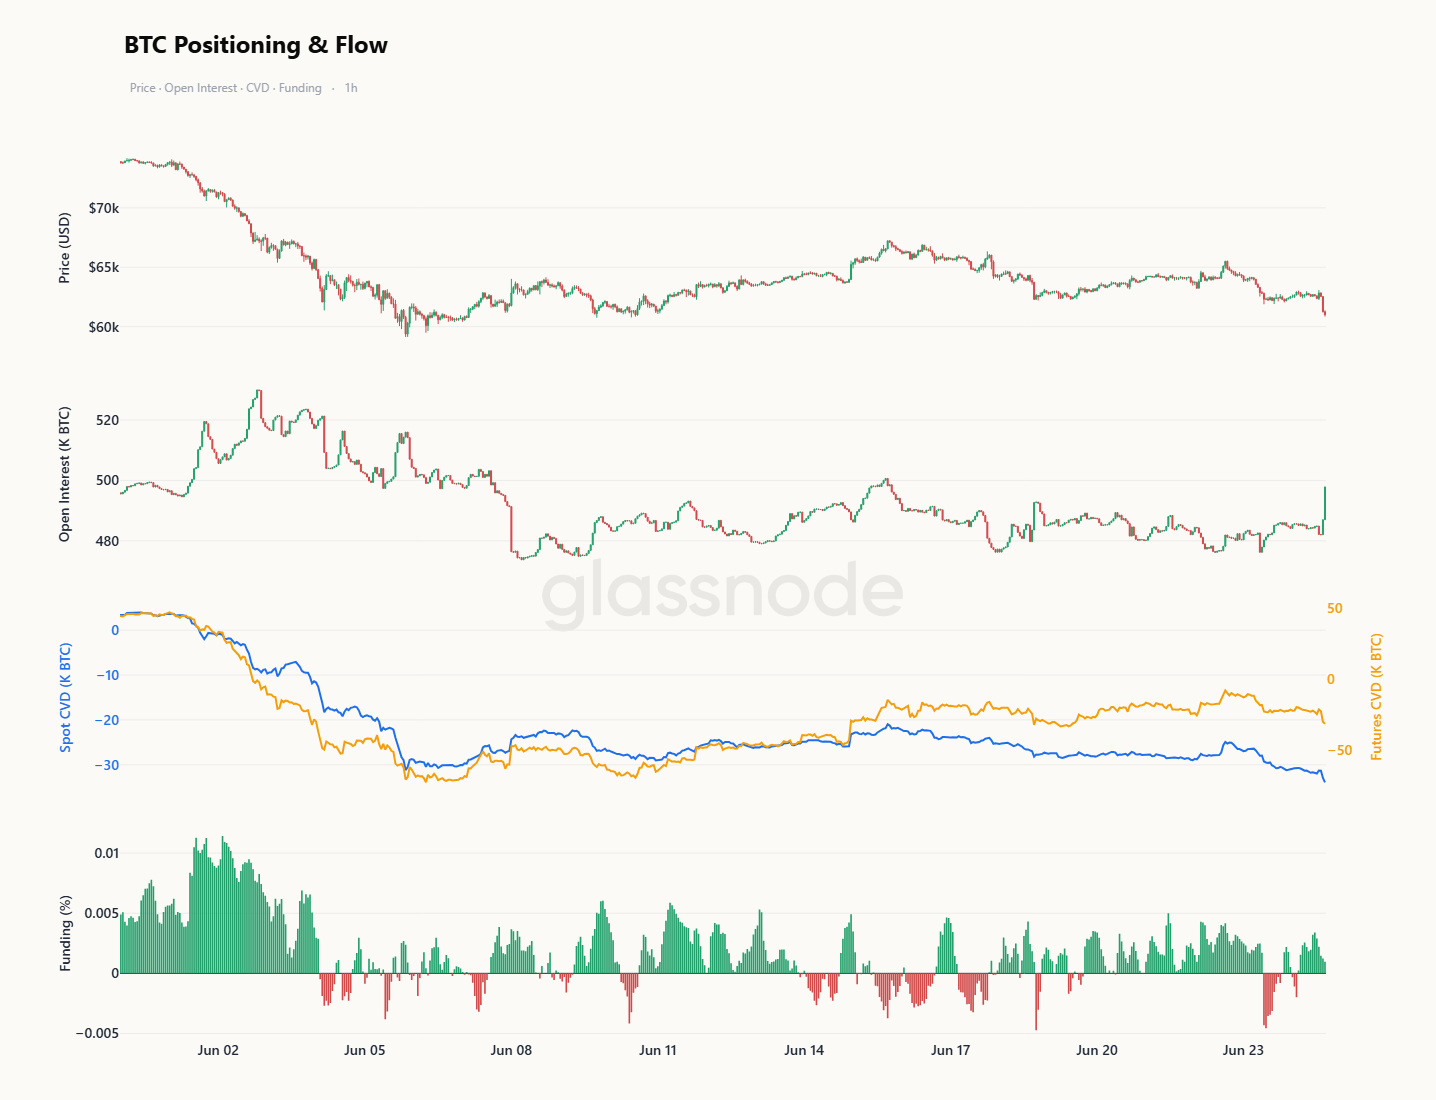
IN A SHORTER TIME FRAME, THE RETURN OF THE LOW $60,000 REGION WAS A SPOT-LED TREND. OVER THE PAST 10 DAYS, THE DROP IN THE SPOT CVD HAS BEEN MUCH FASTER THAN THE FUTURE CVD, A DEPARTURE THAT SHOWS THAT THE RADICAL PRESSURE OF SALES HAS ORIGINATED FROM SPOT LOCATIONS RATHER THAN LEVERAGE-DRIVEN SILOS. THE INTEREST IN REMAINING LOW FOR MOST OF THE TIME DURING THIS DECLINE, AND THE PERSISTENCE OF FINANCIAL RATES EVEN AT THE TIME OF THE DECLINE IN PRICES, INDICATE THAT THERE IS A PERSISTENT RELUCTANCE TO SURRENDER AND THAT THE PRESSURE DOES NOT STEM FROM DERIVATIVE BOOKS。
THIS SITUATION HAS BEGUN TO CHANGE. AS BITCOIN RETURNS TO THE LOW-POINT, INTEREST IN THE HOLD HAS SOARED, FUTURES CVD HAVE NOW BEEN SYNCHRONIZED WITH CURRENTS, INDICATING THAT LEVERAGE PLAYERS HAVE FINALLY JOINED THE MOVEMENT INSTEAD OF CONFRONTING IT. AT THE SAME TIME, THE FALL IN FINANCIAL RATES FROM HIGH LEVELS HAS EASED THE MULTIPLE BIASES THAT ARE INCREASINGLY OUT OF STEP WITH PRICE TRENDS。
ON THE WAY DOWN, CASH TOOK ON THE MAIN RESPONSIBILITY, AND DERIVATIVES ARE NOW FOLLOWING RATHER THAN LEADING. IF INTEREST IN WAREHOUSING CONTINUES TO GROW, WHILE FUTURES CVD RETURNS AND THE FUNDING RATES ARE SOFTENED, IT WILL BE CONFIRMED THAT LEVERAGE IS SURRENDERING TO THE LOW POINT WHERE THE SPOT HAS BEEN SOLD — A WIDESPREAD PARTICIPATION THAT OFTEN MARKS A MORE INTENSE AND OFTEN THOROUGH DISHWASHING PHASE。
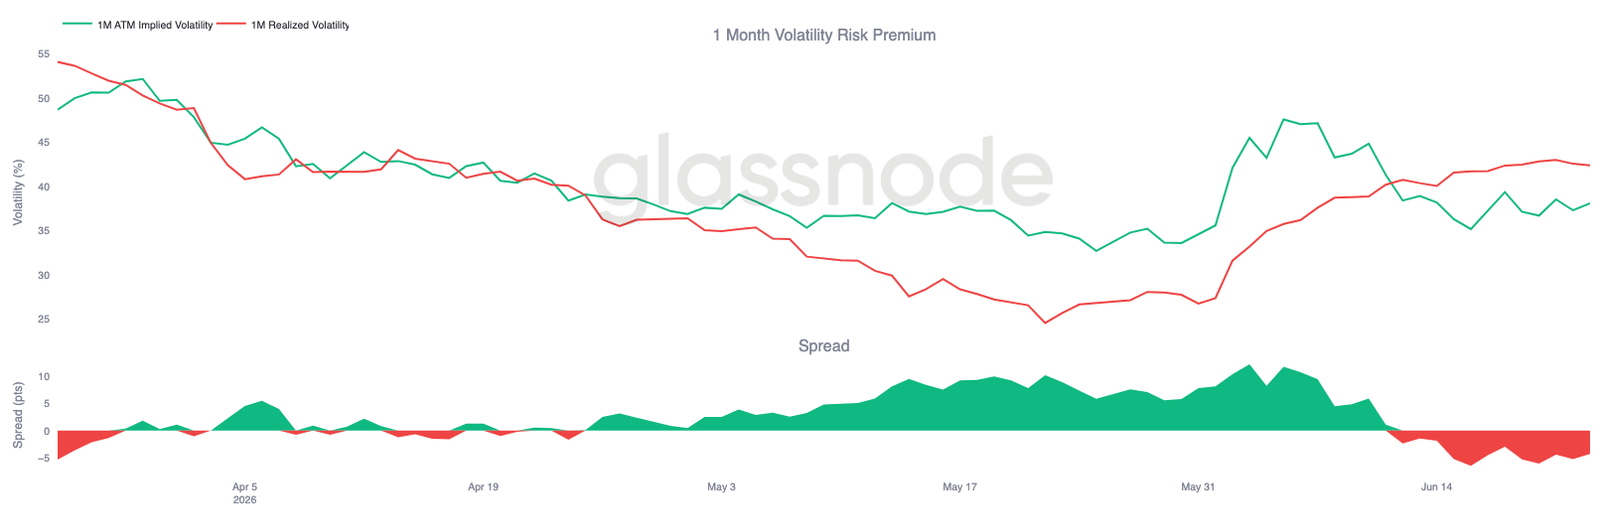
Implied volatility has stabilized after recent heavy pricing
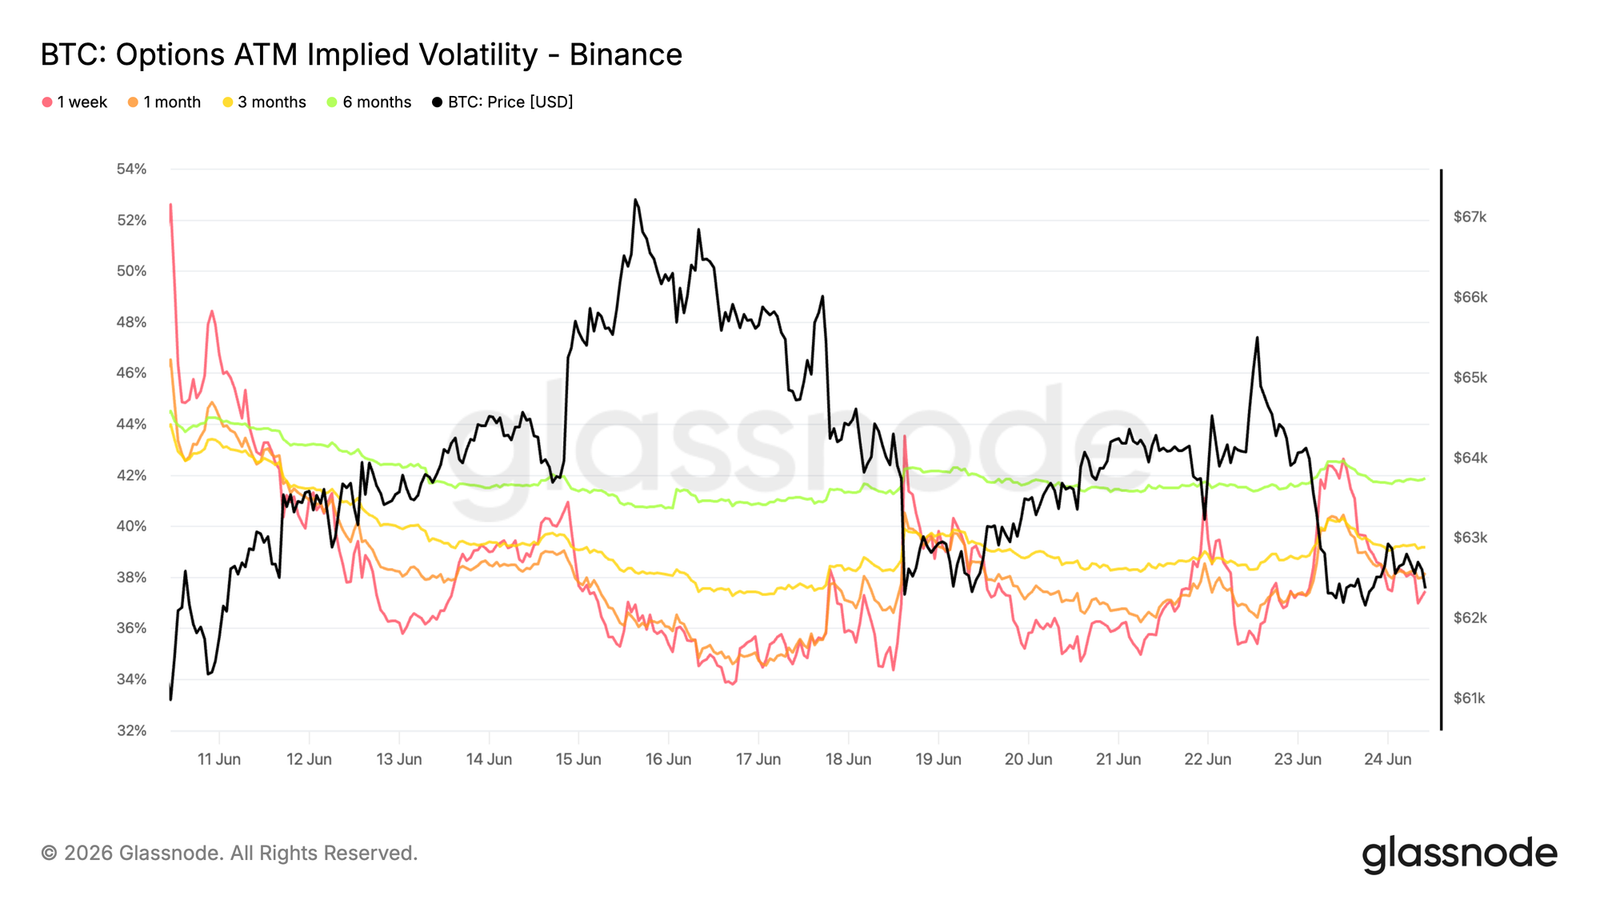
After the fall of Bitcoin to its low June point, the options market has entered a relatively calm zone。
THE FRONT END OF THE CURVE REMAINS THE MOST SENSITIVE PART. ONE WEEK OF IMPLICIT ATM VOLATILITY WAS BRIEFLY OVER 42 PER CENT IN THE LATEST SALE AND THEN BACK TO ABOUT 37 PER CENT. THE ONE-MONTH PERIOD FELL FROM ABOUT 40 PER CENT TO 38 PER CENT, WHILE THE LONGER PERIOD REMAINED RELATIVELY STABLE, WITH IMPLIED FLUCTUATIONS OF ALMOST 39 PER CENT FOR THREE MONTHS AND 42 PER CENT FOR SIX MONTHS。
ALTHOUGH BITCOIN CONTINUES TO SUPPORT TRADE AROUND 60K-63K, THIS STABILITY CONTINUES. THE LACK OF AN ONGOING VOLATILITY BUYOUT INDICATES THAT TRADERS ARE NO LONGER SUBJECT TO AGGRESSIVE RE-PRICING RISKS AND THAT MOST OF THE PROTECTION PREMIUMS DURING THE RECENT STRESS PERIOD HAVE BEEN REMOVED。
Implicit volatility rates have returned to stable zones, and options markets have a lower sense of urgency in pricing additional short-term uncertainties。
Keep the volatility risk premium negative
After the implicit rate of volatility has stabilized, the implied relationship to the realized rate of volatility remains inverted and the risk premium of the volatility rate remains negative。
The one-month implicit volatility rate is currently about 38 per cent, while the realization rate continues to rise to around 42 per cent. As a result, the volatility risk premium remained at about four volatility points, continuing the reversal that had begun with recent market sales。
The chart shows that even after normalizing the implicit volatility rate from its peak in early June, the realized volatility rate remained high. In other words, real market volatility is greater than current options pricing. While the gap is slightly narrower than the recent extreme levels, the implied volatility rate has not yet re-established enough to bring the price differential back positive。
As the realized volatility rate remains above the implied volatility rate, options markets continue to price a more calm environment than recent price actions have shown。
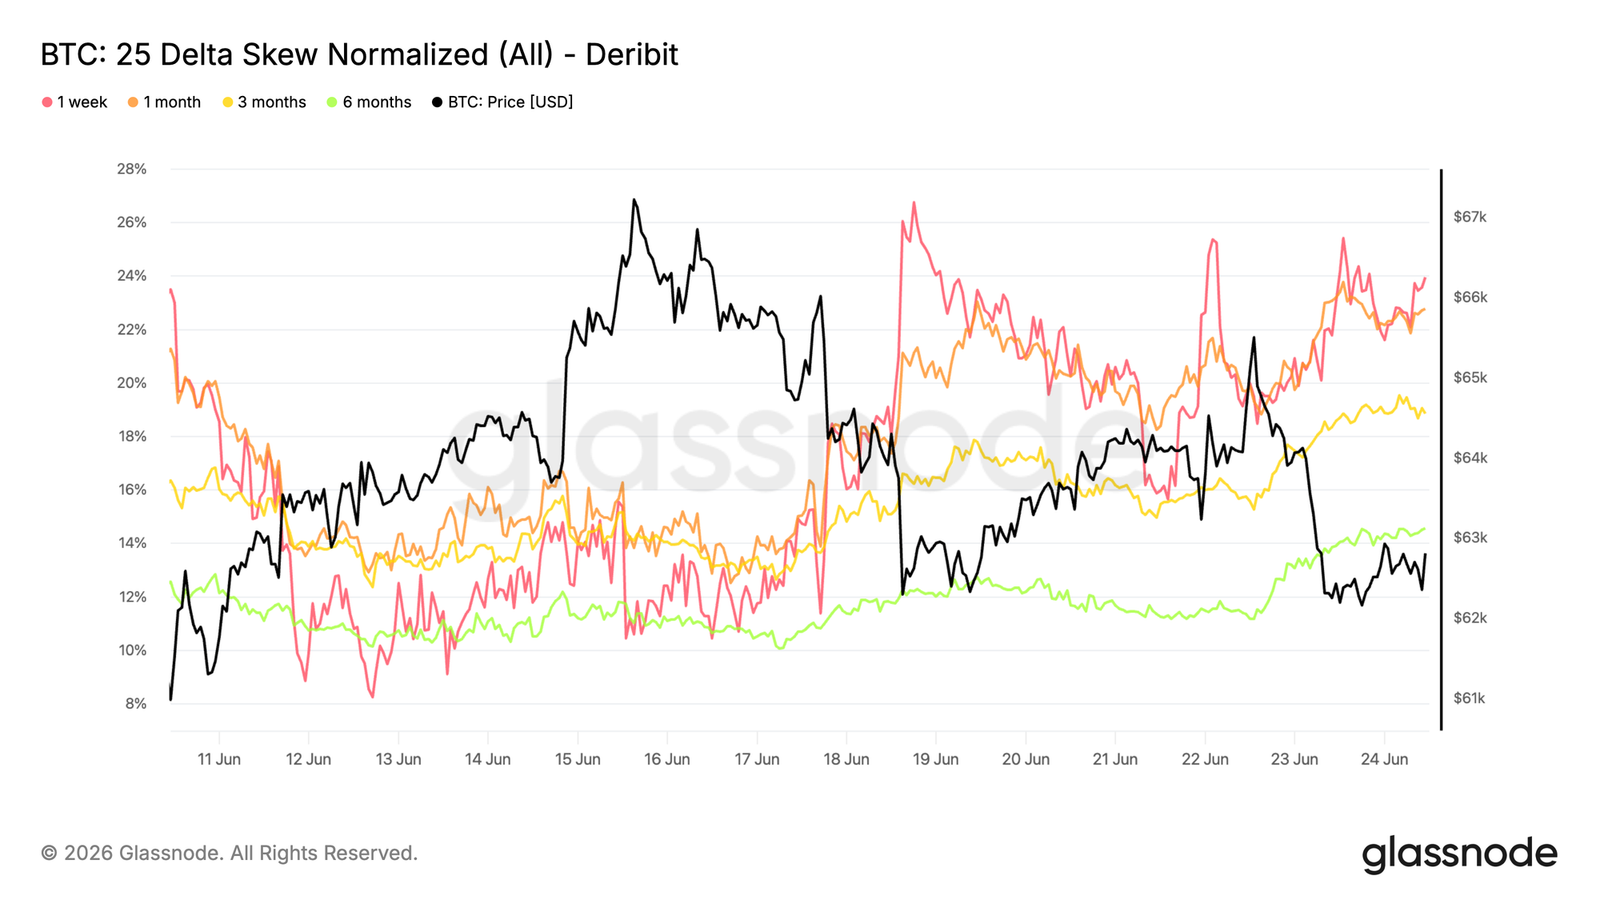
25 Delta Arguments Reconstructed over time
After the volatility risk premium is negative, the bias indicator shows how the bottom protection demand evolves when Bitcoin primarily supports nearby transactions。
The margin is calculated as a drop-over option, minus an increase-up option, and the positive value indicates an increase in the margin-up option over the equivalent. Over the past week, the premium has risen throughout the curve. The one-week bias rose from about 12% to 24% and the one-month period from about 14% to 23%. The three months and six months periods were also high, reaching about 19 per cent and 14 per cent, respectively。
The graph shows that, despite the relative stability of implied fluctuations, extensive re-pricing of protection occurs below. Dealers seem no longer to pay more volatility as a whole, but are increasingly willing to pay premiums for hedges below。
the reconstruction of protection needs over time shows that, despite stable volatility levels, traders still prefer lower hedges。
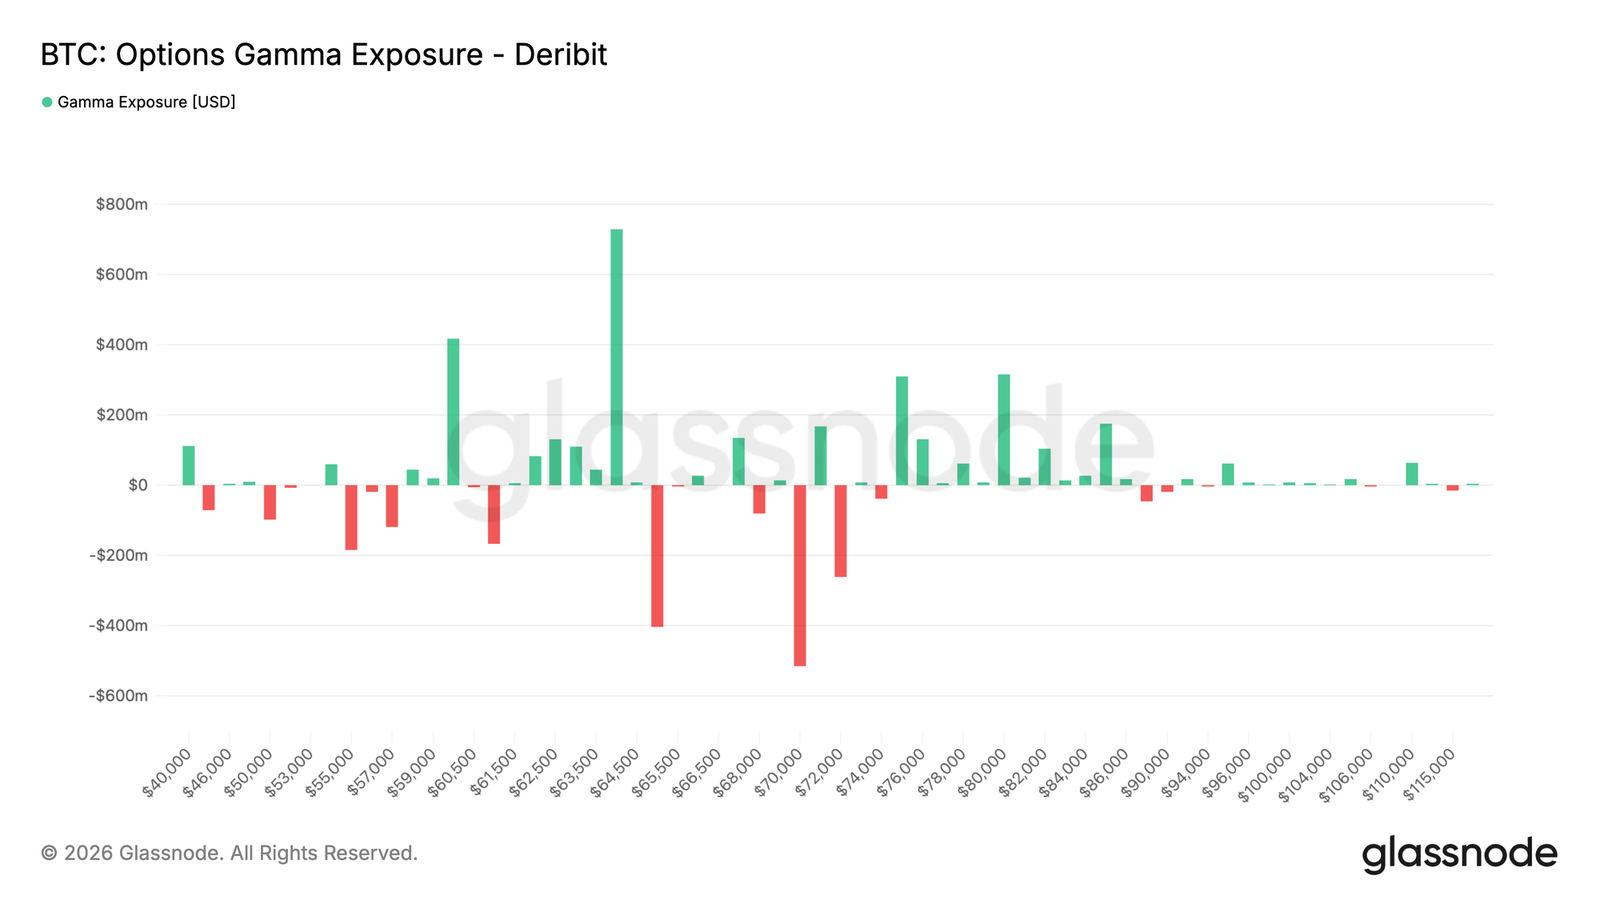
Gamma's openings are concentrated near the current spot
In addition to pricing and emotion, gamma exposure helps to identify levels of market power prices that may have the greatest impact on market dynamics。
Recent financial flows show that traders are more comfortable at selling premiums. Over the past seven days, the highest share of the trading premium was sold at 31.2 per cent. This trend has intensified over the past 24 hours, with downs and downs accounting for 47.2 per cent。
THIS SHIFT IS REFLECTED IN THE GAMMA PROFILE. THE TWO LARGEST POSITIVE-GAMMA CLUSTERS ARE LOCATED IN 60K AND 64K, BETWEEN WHICH BITCOIN IS CURRENTLY TRADED, APPROXIMATELY 62.8K. IN THE POSITIVE GAMMA ZONE, MARKET SPRINTING TENDS TO CONTAIN VOLATILITY AND HELPS TO KEEP THE SPOT WITHIN THE ZONE. IN CONTRAST, THE LATEST NEGATIVE GAMMA CONVERTIBLE IS LOCATED AT 65K AND IS SIGNIFICANTLY SMALLER THAN THE 64K POSITIVE GAMMA CLUSTER。
THE MARKET WAREHOUSE REMAINS DOMINATED BY LONG-GAMMA NEAR CURRENT LEVELS, CREATING CONDITIONS THAT COULD CONTROL FLUCTUATIONS IN 60K-64K。
Conclusions
BITCOIN CONTINUES TO BE TRADED IN A MARKET DEFINED BY PRUDENCE RATHER THAN CONVICTION. CHAIN INDICATORS SHOW A DEEP DISCOUNT ON ASSETS RELATIVE TO THE AVERAGE INVESTOR COST BASE, WHILE PERSISTENT LOSSES SHOW THAT THE BEAR MARKET IS STILL WELL ESTABLISHED. AT THE SAME TIME, THE DEFENSIVE POSITION OF ETF OUT-OF-MARKET AND OPTIONS MARKETS HIGHLIGHTS THE LACK OF BROAD RISK PREFERENCES FOR INSTITUTIONS AND DERIVATIVES PARTICIPANTS。
However, there are early indications that the environment is beginning to stabilize, under the surface. Coinbase has turned to constructive, with a downward adjustment in the short-term holder ' s cost base, and recent vulnerabilities have been driven mainly by spot sellers rather than over-leveraging. While these developments do not signal a reversal, they are consistent with the early characteristics of the bottom formation process。
Markets are still in the middle of a continuous scaffolding between the distribution of emerging value-driven demand, and the game between the two will define the main next movement of bitcoin。
