
The U.S. stock was raging 16% for two months: four times in history, most recently before the crash of 1987
The Deutsche Bank warned that credit spreads were at historically low levels, that consumer confidence had fallen to its lowest level since 1952, that the divergence between debt and stock markets had continued to expand and that multiple risk signals were being ignored by market selectivity。

Original by Jo Wing
Original source:See you on Wall Street
The strong rebound of the United States stock for almost two months is triggering historical alarms. The TPP 500 index increased cumulatively by 16 per cent between April and May, only four times since World War II, three of which occurred in the post-recession recovery phase, with the only precedent in the context of a non-recession, just months before the "Black Monday" crash of 1987。
Deutsche Bank macro strategist Henry Allen pointed out that the current boom did not take place in the context of the recovery of the recession, which made the historical comparison particularly dramatic. At the same time, credit spreads have remained historically low, but consumer pressure signals are gathering, the Fed’s interest rate hikes are expected to warm, and the gap between sovereign bond markets and stock markets continues to widen。
Multiple risk factors have been added, and market tail risks are being concentrated exceptionally. Henry Allen wrote in his reportThe risk at the end of the current distribution is extraordinary, both at geopolitical and market levels."
Historical precedents are rare, only in a non-recessional context
The BS 500 index increased by 16 per cent in the two months from April to May, only four times since World War II。
Three of these were strong rebounds following the recession: the recovery from the April-May 2020 coronary outbreak, the rebound from the global financial crisis of March-April 2009, and the recovery from the first oil crisis of January-February 1975。
The fourth was January-February 1987. Only a few months remained until October of that year, when the 500-day scale fell by 20 per cent。
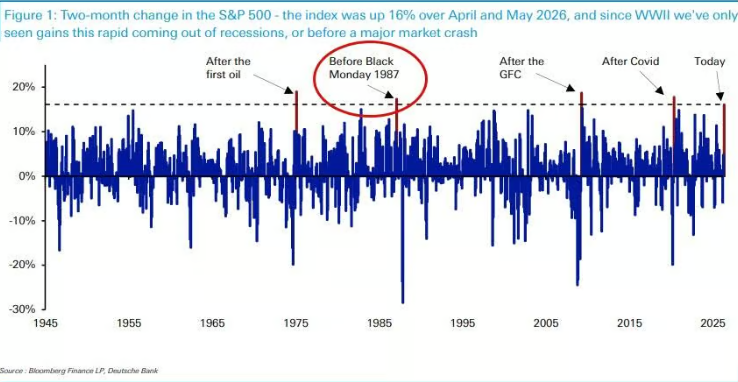
Henry Allen stressed that the current boom was underpinned by fundamentals, including a high level of artificial intelligence enthusiasm and strong economic data, but that "the rate of growth itself has broken all recent precedents". In an economy that has not emerged from recession, the rebound of this pace has never had a good conclusion in history。
In addition, the BS 500 now promises to record a double-digit increase for the fourth consecutive year, a record that has never appeared since the late 1990s。
Credit markets are overly optimistic and consumer pressure signals are ignored
The strength of the stock market has also spread to credit markets. Credit spreads in the United States and Europe are now narrower than they were before the outbreak of the American-Iraq conflict, demonstrating a high degree of market tolerance for risk。
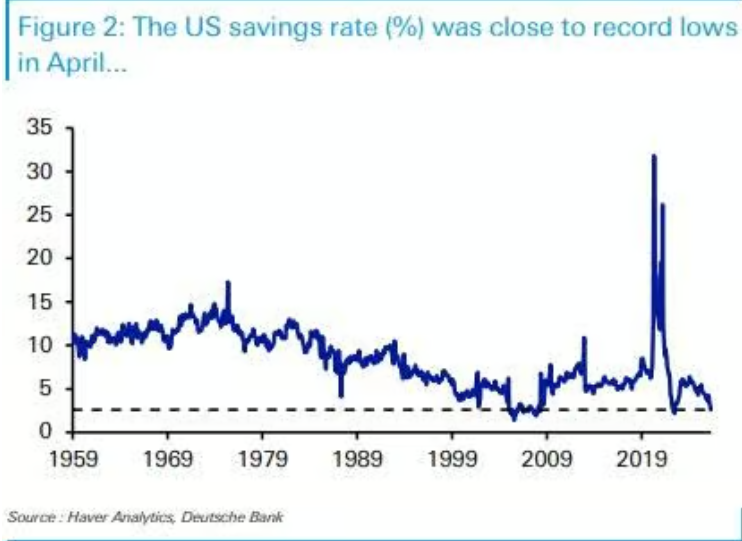
However, warning signals at the consumer level are accumulating。The April savings rate in the United States was only 2.6 per cent, with a similar low in two periods: One single month in 2022, when the excess savings accumulated during the new coronary epidemic were being depleted, and on the eve of the global financial crisis. At the same time, the University of Michigan Consumer Confidence Index reached its lowest ever recorded value in May, since 1952。
THE MONETARY POLICY ENVIRONMENT IS ALSO TIGHTENING. THE EUROPEAN CENTRAL BANK (ECB) IS GENERALLY EXPECTED TO INCREASE INTEREST RATES THIS MONTH, AND THE MARKET'S BET ON THE FED'S 2026 INTEREST RATE HIKE IS RISING — AN EXPECTATION THAT WAS UNDERPINNED BY US PCE INFLATION OF 3.8 PER CENT IN APRIL。
Henry Allen noted that the position of the Fed Eagles had historically tended to coincide with the spread of credit spreads, both in 2022, late 2018 and 2015-2016. The current calm in the credit market is a clear departure from this historical pattern。
The bond market was under pressure alone, and the stock market continued to expand
Although stock and credit markets have shown a high degree of immunity from geopolitical risks, sovereign bond markets have moved out of a very different path。
Over the past month, the 10-year United States Treasury debt rate of return has almost entirely followed oil price fluctuations and was clearly delinked from other asset classes。In mid-May, sovereign bond yields reached high levels for many years: the 30-year rate of return on United States debt rose to 5.18 per cent, the highest since 2007; and the 10-year rate of return on German national debt rose to 3.19 per cent, the highest since 2011。
At that time, the stock market was only one step from its historical high, while bond yields were at levels that had not been seen for more than a decade. This departure has so far shown no signs of abating。
Henry Allen argued that bond markets were more directly priced for inflation and fiscal risks and were therefore more sensitive to the response to geopolitical shocks. The ongoing divergence between the stock market and the debt market is itself an expression of the current market vulnerability。
Unexpected stabilization of oil prices as a key pillar of risk assets
While the Holmuze Strait blockade went well beyond the initial market expectations, the unexpectedly mild reaction of oil prices partly explains the resilience of risk assets。
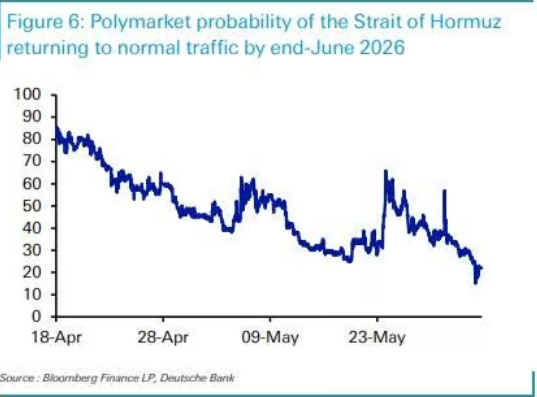
When the conflict between the United States and Iraq broke out on 28 February, the White House initially projected operations to last four to six weeks. To date, however, the Strait of Hormuz remains closed。According to forecasts from the market for Polymarket, the probability of returning to normal navigation by the end of June has dropped sharply from about 80 per cent in mid-April to 22 per cent。
Nevertheless, the oil price futures curve remained relatively stable. Only two weeks after the outbreak of the conflict on 13 March, Brent crude oil received $85.66 per barrel for six months; on 1 June, the contract offer remained near $84.88, almost in place。
Henry Allen noted that it was precisely because the oil price futures curve did not move significantly that investors did not include a significant stagnating risk in their pricing, thus avoiding larger-scale sales of risky assets. At the same time, however, he warned that if the Strait of Hormuz continues to be blocked, the sustainability of this support remains unknown。
